
Recovery in Jun 2020 of Manufacturing Indexes of the Federal Reserve Banks of New York and Philadelphia, Sharp Recovery in Retail Sales in May 2020 In the Global recession, with Output in the US Reaching a High in Feb 2020, Measured by the National Bureau of Economic Research, In the Lockdown of Economic activity in the COVID-19 Event, Recovery of Manufacturing Output in May 2020, Manufacturing Underperforming Cyclically in the Lost Economic Cycle of the Global Recession with Economic Growth Underperforming Below Trend Worldwide, Deep Contraction of Trade Volumes in Major Economies, Increase in Budget Deficit of the United States, Squeeze of Economic Activity by Carry Trades Induced by Zero Interest Rates, United States Inflation, World Cyclical Slow Growth, and Government Intervention in Globalization
Carlos M. Pelaez
© Carlos M. Pelaez, 2009, 2010, 2011, 2012, 2013, 2014, 2015, 2016, 2017, 2018, 2019, 2020.
I United States Industrial Production
IIB Squeeze of Economic Activity by Carry Trades Induced by Zero Interest Rates
IC United States Inflation
IC Long-term US Inflation
ID Current US Inflation
III World Financial Turbulence
IV Global Inflation
V World Economic Slowdown
VA United States
VB Japan
VC China
VD Euro Area
VE Germany
VF France
VG Italy
VH United Kingdom
VI Valuation of Risk Financial Assets
VII Economic Indicators
VIII Interest Rates
IX Conclusion
References
Appendixes
Appendix I The Great Inflation
IIIB Appendix on Safe Haven Currencies
IIIC Appendix on Fiscal Compact
IIID Appendix on European Central Bank Large Scale Lender of Last Resort
IIIG Appendix on Deficit Financing of Growth and the Debt Crisis
Foreword A. Chart VA-1 of the Federal Reserve Bank of New York provides indexes of current and expected economic activity. There were multiple contractions in current activity after the global recession shown in shade. Current activity is weakening relative to strong recovery in the initial expansion in 2010 and 2011 with recent oscillating recovery and weakness. There is sharp improvement in the current index by softer negative reading with strong improvement in the future index in positive reading and nearly positive reading in the current index.
Chart VA-1, US, US, Federal Reserve Bank of New York, Diffusion Index of Current and Expected Activity, Seasonally Adjusted
Source: Federal Reserve Bank of New York
https://www.newyorkfed.org/survey/empire/empiresurvey_overview.html
Chart VA-2 of the Federal Reserve Bank of Philadelphia Manufacturing Business Outlook Survey provides the current and future general activity indexes from Jan 2008 to Jun 2020. The shaded areas are the recession cycle dates of the National Bureau of Economic Research (NBER) (https://www.nber.org/cycles.html). The Philadelphia Fed index dropped during the initial period of recession and then led the recovery, as industry overall. There was a second decline of the index into 2011 followed now by what appeared as renewed strength from late 2011 into Jan 2012. There is decline to negative territory of the current activity index in Nov 2012 and return to positive territory in Dec 2012 with decline of current conditions into contraction in Jan-Feb 2013 and rebound to mild expansion in Mar-Apr 2013. The index of current activity moved into expansion in Jun-Oct 2013 with weakness in Nov-Dec 2013, improving in Jan 2014. There is renewed deterioration in Feb 2014 with rebound in Apr-Sep 2014 and mild deterioration in Oct 2014 followed by improvement in Nov 2014. The index deteriorated in Jan-Feb 2015, stabilizing in Mar-May 2015 and improving in Jun 2015. The index deteriorated in Jul 2015, improved in Aug 2015 and deteriorated in Sep-Oct 2015. The index shows contraction in Nov 2015 to Feb 2016 with recovery in Mar 2016. There is deterioration in Apr-May 2016 with improvement in Jun 2016 and deterioration in Jul 2016. There is improvement in Aug-Sep 2016 with moderate weakening in Oct-Nov 2016. The indexes improved sharply in Dec 2016 and Jan-Feb 2017, softening in Mar-Apr 2017. The current index weakened in Jun 2017 with stability in the six-month forecast. The current index deteriorated in Jul 2017 with improvement in the six-month forecast. The current index deteriorated in Aug 2017 with improvement in the six-month forecast. The current index improved in Sep 2017 with improvement in the six-month forecast. The current index improved and the future index deteriorated in Oct 2017. There is deterioration in Nov 2017 of the current index and improvement of the future index. Both the current and future indexes improved in Dec 2017, deteriorating in Jan 2018. There is improvement of the current index in Feb 2018 with mild deterioration in the future index. The current index improves in Apr 2018 while the future index weakens. There is improvement in the current index in May 2018 with weakening of the future index. There is weakening in the current index in Jun 2018 while the future index weakens. The current index improves in Jul 2018 while the future index weakens. There is weakening of the current index in Aug 2018 while the future index improves. The current index improves in Sep 2018 while the future index weakens. The current index weakens in Oct 2018 while the future index weakens. The current index deteriorates in Nov 2018 while the future index deteriorates. The current index deteriorates in Dec 2018 while the future index improves. The current index improves in Jan 2019 while the future index improves. The current index deteriorates in Feb 2019 while the future index improves. The current index improves in Mar 2019 while the future index deteriorates. The current index deteriorates in Apr 2019 while the future index deteriorates. The current index improves in May 2019 while the future index improves. The current index deteriorates in Jun 2019 while the future index improves. The current index improves in Jul 2019 while the future index improves. The current index deteriorates in Aug 2019 while the future index deteriorates. The current index deteriorates in Sep 2019 while the future index deteriorates. The current index deteriorates in Oct 2019 while the future index improves. The current index improves in Nov 2019 while the future index improves. The current index deteriorates in Dec 2019 while the future index deteriorates. The current index improves in Jan 2020 while the future index improves. The current index improves in Feb 2020 while the future index improves. The current index contracts in Mar 2020 while the future index deteriorates. The current index contracts in Apr 2020 while the future index deteriorates. The current index improves in May 2020 while the future index improves. The current index expands again in Jun 2020 while the future index improves.
Chart VA-2, Federal Reserve Bank of Philadelphia Business Outlook Survey, Current and Future Activity Indexes
Source: Federal Reserve Bank of Philadelphia
https://www.philadelphiafed.org/
Foreword B. Sales of retail and food services increased 17.7 percent in May 2020, after decreasing 14.7 percent in Apr 2020 seasonally adjusted (SA), in the global recession, with output in the US reaching a high in Feb 2020 (https://www.nber.org/cycles.html), in the lockdown of economic activity in the COVID-19 event, decreasing 4.7 percent in May 2020 relative to May 2019 not seasonally adjusted (NSA), as shown in Table VA-3. Excluding motor vehicles and parts, retail sales increased 12.4 percent in May 2020, decreasing 15.2 percent in Apr 2020 SA and decreasing 3.2 percent NSA in May 2020 relative to a year earlier. Sales of motor vehicles and parts increased 44.1 percent in May 2020 after decreasing 12.3 percent in Apr 2020 SA and decreasing 10.5 percent NSA in May 2020 relative to a year earlier. Gasoline station sales increased 12.8 percent SA in May 2020 after decreasing 24.4 percent in May 2020 in oscillating prices of gasoline that are moderating, decreasing 16.7 percent in May 2020 relative to a year earlier.
Table VA-3, US, Percentage Change in Monthly Sales for Retail and Food Services, ∆%
May ∆% SA | Apr ∆% SA | Jan-May 2020 Million Dollars NSA | Jan-May 2020 from Jan-May 2019 ∆% NSA | |
Retail and Food Services | 17.7 | -14.7 | 2,358,235 | -4.7 |
Excluding Motor Vehicles and Parts | 12.4 | -15.2 | 1,909,858 | -3.2 |
Motor Vehicles & Parts Dealers | 44.1 | -12.3 | 448,377 | -10.5 |
Retail | 16.8 | -12.7 | 2,116,588 | -2.2 |
Building Materials | 10.9 | -2.4 | 167,426 | 6.7 |
Food and Beverage | 2.0 | -12.8 | 349,893 | 13.1 |
Grocery | 1.3 | -13.3 | 315,597 | 13.6 |
Health & Personal Care Stores | 0.4 | -14.8 | 144,410 | -2.4 |
Clothing & Clothing Accessories Stores | 188.0 | -75.2 | 57,400 | -42.9 |
Gasoline Stations | 12.8 | -24.4 | 166,761 | -16.7 |
General Merchandise Stores | 6.0 | -13.6 | 285,459 | 2.6 |
Food Services & Drinking Places | 29.1 | -34.6 | 241,647 | -22.3 |
Source: US Census Bureau https://www.census.gov/retail/index.html
Chart VA-6A provides monthly percentage changes of sales of retail and food services from Jan 2019 to May 2020.There is vertical increase in May 2020 after collapse in Feb-Apr 2020.
Chart VA-6A, US, Monthly Percentage Change of Retail and Food Services Sales, Jan 2019-May 2020
Source: US Census Bureau https://www.census.gov/retail/index.html
Chart VA-7 of the US Census Bureau provides total sales of retail trade and food services seasonally adjusted (SA) from Jan 1992 to May 2020 in millions of dollars. The impact on sales of the shallow recession of 2001 was much milder than the sharp contraction in the global recession from IVQ2007 to IIQ2009. There is flattening in the final segment of the series followed by another increase/decrease. Sales collapsed in the lockdown of economic activity in the COVID-19 event. Data are not adjusted for price changes. There is sharp decline in Feb-Mar 2020 with sharp recovery in May 2020.
Chart VA-7, US, Total Sales of Retail Trade and Food Services, SA, Jan 1992-May 2020, Millions of Dollars
Source: US Census Bureau https://www.census.gov/retail/index.html
Chart VA-7 of the US Census Bureau provides total sales of retail trade and food services seasonally adjusted (SA) from Jan 2019 to May 2020 in millions of dollars. Sales jumped in May 2020 in recovery from the contraction in Feb-Mar 2020.
Chart VA-7A, US, Total Sales of Retail Trade and Food Services, SA, Jan 2019-May 2020, Millions of Dollars
Source: US Census Bureau https://www.census.gov/retail/index.html
Chart VA-8 of the US Census Bureau provides total sales of retail trade and food services seasonally adjusted (NSA) from Jan 1992 to May 2020 in millions of dollars. Data are not adjusted for price changes. There is sharp contraction in Feb-Apr 2020, in the global recession, with output in the US reaching a high in Feb 2020 (https://www.nber.org/cycles.html), in the lockdown of economic activity in the COVID-19 event, with sharp recovery in May 2020.
Chart VA-8, US, Total Sales of Retail Trade and Food Services, NSA, Jan 1992-Apr 2020, Millions of Dollars
Source: US Census Bureau https://www.census.gov/retail/index.html
Chart VA-8A of the US Census Bureau provides total sales of retail trade and food services seasonally adjusted (NSA) from Jan 2019 to May 2020 in millions of dollars. Data are not adjusted for price changes. There is sharp recovery in May 2020.
Chart VA-8A, US, Total Sales of Retail Trade and Food Services, NSA, Jan 2019-May 2020, Millions of Dollars
Source: US Census Bureau https://www.census.gov/retail/index.html
V World Economic Slowdown. Table V-1 is constructed with the database of the IMF (https://www.imf.org/external/pubs/ft/weo/2020/01/weodata/index.aspx) to show GDP in dollars in 2018 and the growth rate of real GDP of the world and selected regional countries from 2018 to 2021. The data illustrate the concept often repeated of “two-speed recovery” of the world economy from the recession of 2007 to 2009. There is a major change in the sharp contraction of world real GDP of 3.1 percent in 2020 in the probable global recession originating in the lockdown of economic activity in the COVID-19 event. The IMF has changed its measurement of growth of the world economy to 3.6 percent in 2018 and reducing the forecast rate of growth to 2.9 percent in 2019, minus 3.1 percent in 2020 and 5.8 percent in 2021. Slow-speed recovery occurs in the “major advanced economies” of the G7 that are projected to grow at much lower rates than world output, 0.4 percent on average from 2018 to 2021, in contrast with 2.2 percent for the world as a whole. While the world would grow 9.3 percent in the four years from 2018 to 2021, the G7 as a whole would grow 1.6 percent. The “two speed” concept is in reference to the growth of the 150 countries labeled as emerging and developing economies (EMDE). The EMDEs would grow cumulatively 14.2 percent or at the average yearly rate of 3.4 percent.
Table V-1, IMF World Economic Outlook Database Projections of Real GDP Growth
GDP USD Billions 2018 | Real GDP ∆% | Real GDP ∆% | Real GDP ∆% | Real GDP ∆% | |
World | 135,762 | 3.6 | 2.9 | -3.1 | 5.8 |
G7 | 40,783 | 2.0 | 1.6 | -6.2 | 4.5 |
Canada | 1,842 | 2.0 | 1.6 | -6.2 | 4.3 |
France | 2,970 | 1.7 | 1.3 | -7.2 | 4.5 |
DE | 4,343 | 1.5 | 0.6 | -7.0 | 5.2 |
Italy | 2,406 | 0.8 | 0.3 | -9.1 | 4.8 |
Japan | 5,578 | 0.3 | 0.7 | -5.2 | 3.0 |
UK | 3,065 | 1.3 | 1.4 | -6.5 | 4.0 |
US | 20,580 | 2.9 | 2.3 | -5.9 | 4.7 |
Euro Area | NA | 1.9 | 1.2 | -7.5 | 4.7 |
DE | 4,343 | 1.5 | 0.6 | -7.0 | 5.2 |
France | 2,970 | 1.7 | 1.3 | 7.2 | 4.5 |
Italy | 2,406 | 0.8 | 0.3 | -9.1 | 4.8 |
POT | 334 | 2.6 | 2.2 | -8.0 | 5.0 |
Ireland | 389 | 8.3 | 5.5 | -6.8 | 6.3 |
Greece | 312 | 1.9 | 1.9 | -10.0 | 5.1 |
Spain | 1,854 | 2.4 | 2.0 | -8.0 | 4.3 |
EMDE | 80,401 | 4.5 | 3.7 | -1.1 | 6.6 |
Brazil | 3,383 | 1.3 | 1.1 | -5.3 | 2.9 |
Russia | 4,258 | 2.5 | 1.3 | -5.5 | 3.5 |
India | 10,413 | 6.1 | 4.2 | 1.9 | 7.4 |
China | 25,294 | 6.8 | 6.1 | 1.2 | 9.2 |
Notes; DE: Germany; EMDE: Emerging and Developing Economies (150 countries); POT: Portugal
Source: IMF World Economic Outlook databank
https://www.imf.org/external/pubs/ft/weo/2020/01/weodata/index.aspx
Continuing high rates of unemployment in advanced economies constitute another characteristic of the database of the WEO (Continuing high rates of unemployment in advanced economies constitute another characteristic of the database of the WEO (https://www.imf.org/external/pubs/ft/weo/2019/02/weodata/index.aspx). Table V-2 is constructed with the WEO database to provide rates of unemployment from 2017 to 2021 for major countries and regions. In fact, unemployment rates for 2017 in Table V-2 are high for all countries: unusually high for countries with high rates most of the time and unusually high for countries with low rates most of the time. The rates of unemployment are particularly high in 2017 for the countries with sovereign debt difficulties in Europe: 8.9 percent for Portugal (POT), 6.7 percent for Ireland, 21.5 percent for Greece, 17.2 percent for Spain and 11.3 percent for Italy, which is lower but still high. The G7 rate of unemployment is 5.0 percent. Unemployment rates are not likely to decrease substantially if relative slow cyclical growth persists in advanced economies. There are sharp increases in the rates of unemployment in 2020 in the probable global recession originating in the lockdown of economy activity in the COVID-19 event. The rate of unemployment increases to 7.8 percent for the G7 countries and 10.4 percent for the euro area.
Table V-2, IMF World Economic Outlook Database Projections of Unemployment Rate as Percent of Labor Force
% Labor Force 2017 | % Labor Force 2018 | % Labor Force 2019 | % Labor Force 2020 | % Labor Force 2021 | |
World | NA | NA | NA | NA | NA |
G7 | 5.0 | 4.5 | 4.3 | 7.8 | 6.9 |
Canada | 6.3 | 5.8 | 5.7 | 7.5 | 7.2 |
France | 9.4 | 9.0 | 8.5 | 10.4 | 10.4 |
DE | 3.8 | 3.4 | 3.2 | 3.9 | 3.5 |
Italy | 11.3 | 10.6 | 10.0 | 12.7 | 10.5 |
Japan | 2.8 | 2.4 | 2.4 | 3.0 | 2.3 |
UK | 4.4 | 4.1 | 3.8 | 4.8 | 4.4 |
US | 4.3 | 3.9 | 3.7 | 10.4 | 9.1 |
Euro Area | 9.1 | 8.2 | 7.6 | 10.4 | 8.9 |
DE | 3.8 | 3.4 | 3.2 | 3.9 | 3.5 |
France | 9.4 | 9.0 | 8.5 | 10.4 | 10.4 |
Italy | 11.3 | 10.6 | 10.0 | 12.7 | 10.5 |
POT | 8.9 | 7.0 | 6.5 | 13.9 | 8.7 |
Ireland | 6.7 | 5.8 | 5.0 | 12.1 | 7.9 |
Greece | 21.5 | 19.3 | 17.3 | 22.3 | 19.0 |
Spain | 17.2 | 15.3 | 14.1 | 20.8 | 17.5 |
EMDE | NA | NA | NA | NA | NA |
Brazil | 12.8 | 12.3 | 11.9 | 14.7 | 13.5 |
Russia | 5.2 | 4.8 | 4.6 | 4.9 | 4.8 |
India | NA | NA | NA | NA | NA |
China | 3.9 | 3.8 | 3.6 | 4.3 | 3.8 |
Notes; DE: Germany; EMDE: Emerging and Developing Economies (150 countries)
Source: IMF World Economic Outlook
https://www.imf.org/external/pubs/ft/weo/2020/01/weodata/index.aspx
There are references to adverse periods as “lost decades.” There is a more prolonged and adverse period in Table V-3A: the lost economic cycle of the Global Recession with economic growth underperforming below trend worldwide. Economic contractions were relatively high but not comparable to the decline of GDP during the Great Depression. In fact, during the Great Depression in the four years of 1930 to 1933, US GDP in constant dollars fell 26.3 percent cumulatively and fell 45.3 percent in current dollars (Pelaez and Pelaez, Financial Regulation after the Global Recession (2009a), 150-2, Pelaez and Pelaez, Globalization and the State, Vol. II (2009b), 205-7 and revisions in http://bea.gov/iTable/index_nipa.cfm). Data are available for the 1930s only on a yearly basis. The contraction of GDP in the current cycle of the Global Recession was much lower, 4.0 percent ()https://cmpassocregulationblog.blogspot.com/2020/05/mediocre-cyclical-united-states_31.html and earlier https://cmpassocregulationblog.blogspot.com/2020/05/mediocre-cyclical-united-states.html. Contractions were deeper in Japan, 8.6 percent, the euro area (19 members), 5.7 percent, Germany 6.9 percent and the UK 6.0 percent. The contraction in France was 3.9 percent. There is adversity in low rates of growth during the expansion that did not compensate for the contraction such that for the whole cycle performance is disappointingly low. As a result, GDP is substantially below what it would have been in trend growth in all countries and regions in the world. Long-term economic performance in the United States consisted of trend growth of GDP at 3 percent per year and of per capita GDP at 2 percent per year as measured for 1870 to 2010 by Robert E Lucas (2011May). The economy returned to trend growth after adverse events such as wars and recessions. The key characteristic of adversities such as recessions was much higher rates of growth in expansion periods that permitted the economy to recover output, income and employment losses that occurred during the contractions. Over the business cycle, the economy compensated the losses of contractions with higher growth in expansions to maintain trend growth of GDP of 3 percent and of GDP per capita of 2 percent. The US maintained growth at 3.0 percent on average over entire cycles with expansions at higher rates compensating for contractions. US economic growth has been at only 2.1 percent on average in the cyclical expansion in the 43 quarters from IIIQ2009 to IQ2020 and in the global recession with output in the US reaching a high in Feb 2020 (https://www.nber.org/cycles.html), in the lockdown of economic activity in the COVID-19 event. Boskin (2010Sep) measures that the US economy grew at 6.2 percent in the first four quarters and 4.5 percent in the first 12 quarters after the trough in the second quarter of 1975; and at 7.7 percent in the first four quarters and 5.8 percent in the first 12 quarters after the trough in the first quarter of 1983 (Professor Michael J. Boskin, Summer of Discontent, Wall Street Journal, Sep 2, 2010 http://professional.wsj.com/article/SB10001424052748703882304575465462926649950.html). There are new calculations using the revision of US GDP and personal income data since 1929 by the Bureau of Economic Analysis (BEA) (http://bea.gov/iTable/index_nipa.cfm) and the second estimate of GDP for IQ2020 (https://www.bea.gov/sites/default/files/2020-05/gdp1q20_2nd.pdf). The average of 7.7 percent in the first four quarters of major cyclical expansions is in contrast with the rate of growth in the first four quarters of the expansion from IIIQ2009 to IIQ2010 of only 2.8 percent obtained by dividing GDP of $15,557.3 billion in IIQ2010 by GDP of $15,134.1 billion in IIQ2009 {[($15,557.3/$15,134.1) -1]100 = 2.8%], or accumulating the quarter on quarter growth rates (https://cmpassocregulationblog.blogspot.com/2020/05/mediocre-cyclical-united-states_31.html and earlier https://cmpassocregulationblog.blogspot.com/2020/05/mediocre-cyclical-united-states.html). The expansion from IQ1983 to IQ1986 was at the average annual growth rate of 5.7 percent, 5.3 percent from IQ1983 to IIIQ1986, 5.1 percent from IQ1983 to IVQ1986, 5.0 percent from IQ1983 to IQ1987, 5.0 percent from IQ1983 to IIQ1987, 4.9 percent from IQ1983 to IIIQ1987, 5.0 percent from IQ1983 to IVQ1987, 4.9 percent from IQ1983 to IIQ1988, 4.8 percent from IQ1983 to IIIQ1988, 4.8 percent from IQ1983 to IVQ1988, 4.8 percent from IQ1983 to IQ1989, 4.7 percent from IQ1983 to IIQ1989, 4.6 percent from IQ1983 to IIIQ1989, 4.5 percent from IQ1983 to IVQ1989. 4.5 percent from IQ1983 to IQ1990, 4.4 percent from IQ1983 to IIQ1990, 4.3 percent from IQ1983 to IIIQ1990, 4.0 percent from IQ1983 to IVQ1990, 3.8 percent from IQ1983 to IQ1991, 3.8 percent from IQ1983 to IIQ1991, 3.8 percent from IQ1983 to IIIQ1991, 3.7 percent from IQ1983 to IVQ1991, 3.7 percent from IQ1983 to IQ1992, 3.7 percent from IQ1983 to IIQ1992, 3.7 percent from IQ1983 to IIIQ2019, 3.8 percent from IQ1983 to IVQ1992, 3.7 percent from IQ1983 to IQ1993, 3.6 percent from IQ1983 to IIQ1993, 3.6 percent from IQ1983 to IIIQ1993 and at 7.9 percent from IQ1983 to IVQ1983 (https://cmpassocregulationblog.blogspot.com/2020/05/mediocre-cyclical-united-states_31.html and earlier https://cmpassocregulationblog.blogspot.com/2020/05/mediocre-cyclical-united-states.html). The National Bureau of Economic Research (NBER) dates a contraction of the US from IQ1990 (Jul) to IQ1991 (Mar) (https://www.nber.org/cycles.html). The expansion lasted until another contraction beginning in IQ2001 (Mar). US GDP contracted 1.3 percent from the pre-recession peak of $8983.9 billion of chained 2009 dollars in IIIQ1990 to the trough of $8865.6 billion in IQ1991 (https://apps.bea.gov/iTable/index_nipa.cfm). The US maintained growth at 3.0 percent on average over entire cycles with expansions at higher rates compensating for contractions. Growth at trend in the entire cycle from IVQ2007 to IQ2020 and in the global recession with output in the US reaching a high in Feb 2020 (https://www.nber.org/cycles.html), in the lockdown of economic activity in the COVID-19 event would have accumulated to 43.6 percent. GDP in IQ2020 would be $22,634.2 billion (in constant dollars of 2012) if the US had grown at trend, which is higher by $3659.5 billion than actual $18,974.7billion. There are more than three trillion dollars of GDP less than at trend, explaining the 47.4 million unemployed or underemployed equivalent to actual unemployment/underemployment of 27.5 percent of the effective labor force with the largest part originating in the global recession with output in the US reaching a high in Feb 2020 (https://www.nber.org/cycles.html), in the lockdown of economic activity in the COVID-19 event (https://cmpassocregulationblog.blogspot.com/2020/06/creation-of-three-million-private.html and earlier https://cmpassocregulationblog.blogspot.com/2020/05/fifty-two-million-unemployed-or.html). Unemployment is increasing sharply while employment is declining rapidly because of the lockdown of economic activity in the global recession resulting from the COVID-19 event (https://www.bls.gov/cps/employment-situation-covid19-faq-april-2020.pdf). US GDP in IQ2020 is 16.2 percent lower than at trend. US GDP grew from $15,762.0 billion in IVQ2007 in constant dollars to $18,974.7 billion in IQ2020 or 20.4 percent at the average annual equivalent rate of 1.5 percent. Professor John H. Cochrane (2014Jul2) estimates US GDP at more than 10 percent below trend. Cochrane (2016May02) measures GDP growth in the US at average 3.5 percent per year from 1950 to 2000 and only at 1.76 percent per year from 2000 to 2015 with only at 2.0 percent annual equivalent in the current expansion. Cochrane (2016May02) proposes drastic changes in regulation and legal obstacles to private economic activity. The US missed the opportunity to grow at higher rates during the expansion and it is difficult to catch up because growth rates in the final periods of expansions tend to decline. The US missed the opportunity for recovery of output and employment always afforded in the first four quarters of expansion from recessions. Zero interest rates and quantitative easing were not required or present in successful cyclical expansions and in secular economic growth at 3.0 percent per year and 2.0 percent per capita as measured by Lucas (2011May). There is cyclical uncommonly slow growth in the US instead of allegations of secular stagnation. There is similar behavior in manufacturing. There is classic research on analyzing deviations of output from trend (see for example Schumpeter 1939, Hicks 1950, Lucas 1975, Sargent and Sims 1977). The long-term trend is growth of manufacturing at average 2.9 percent per year from May 1919 to May 2020. Growth at 2.9 percent per year would raise the NSA index of manufacturing output (SIC, Standard Industrial Classification) from 108.2987 in Dec 2007 to 154.4475 in May 2020. The actual index NSA in May 2020 is 87.3585 which is 43.4 percent below trend. The underperformance of manufacturing in May 2020 originates partly in the earlier global recession augmented by the current global recession with output in the US reaching a high in Feb 2020 (https://www.nber.org/cycles.html), in the lockdown of economic activity in the COVID-19. Manufacturing grew at the average annual rate of 3.3 percent between Dec 1986 and Dec 2006. Growth at 3.3 percent per year would raise the NSA index of manufacturing output (SIC, Standard Industrial Classification) from 108.2987 in Dec 2007 to 162.0699 in May 2020. The actual index NSA in May 2020 is 87.3585, which is 46.1 percent below trend. Manufacturing output grew at average 1.4 percent between Dec 1986 and May 2020. Using trend growth of 1.4 percent per year, the index would increase to 128.7047 in May 2020. The output of manufacturing at 87.3585 in May 2020 is 32.1 percent below trend under this alternative calculation. Using the NAICS (North American Industry Classification System), manufacturing output fell from the high of 110.5147 in Jun 2007 to the low of 86.3800 in Apr 2009 or 21.8 percent. The NAICS manufacturing index increased from 86.3800 in Apr 2009 to 88.2710 in May 2020 or 2.2 percent. The NAICS manufacturing index increased at the annual equivalent rate of 3.5 percent from Dec 1986 to Dec 2006. Growth at 3.5 percent would increase the NAICS manufacturing output index from 106.6777 in Dec 2007 to 163.5246 in May 2020. The NAICS index at 88.2710 in May 2020 is 46.0 below trend. The NAICS manufacturing output index grew at 1.7 percent annual equivalent from Dec 1999 to Dec 2006. Growth at 1.7 percent would raise the NAICS manufacturing output index from 106.6777 in Dec 2007 to 131.5151 in May 2020. The NAICS index at 88.2710 in May 2020 is 32.9 percent below trend under this alternative calculation.
Table V-3A, Cycle 2007-2020, Percentage Contraction, Average Growth Rate in Expansion, Average Growth Rate in Whole Cycle and GDP Percent Below Trend
Contraction ∆% | Expansion Average ∆% | Whole Cycle Average ∆% | Below Trend Percent | |
USA | 4.0 | 2.1 | 1.5 | 16.2 |
Japan | 8.6 | 1.2 | 0.3 | NA |
Euro Area 19 | 5.7 | 1.0 | 0.4 | 20.2 |
France | 3.9 | 0.8 | 0.4 | 15.4 |
Germany | 7.0 | 1.7 | 0.9 | NA |
UK | 6.0 | 1.6 | 0.9 | 20.1 |
Note: AV: Average. Expansion and Whole Cycle AV ∆% calculated with quarterly growth, seasonally adjusted and quarterly adjusted when applicable, rates and converted into annual equivalent. Combines the Global Recession after 2007 and the COVID-19 Global Recession after IQ2020.
Data reported periodically in this blog.
Source: Country Statistical Agencies https://www.bls.gov/bls/other.htm https://www.census.gov/programs-surveys/international-programs/about/related-sites.html
Manufacturing is underperforming in the lost cycle of the global recession. Manufacturing (NAICS) in May 2020 is lower by 20.1 percent relative to the peak in Jun 2007, as shown in Chart V-3A. Manufacturing (SIC) in May 2020 at 87.3585 is lower by 22.2 percent relative to the peak at 112.3113 in Jun 2007. There is cyclical uncommonly slow growth in the US instead of allegations of secular stagnation. There is similar behavior in manufacturing. There is classic research on analyzing deviations of output from trend (see for example Schumpeter 1939, Hicks 1950, Lucas 1975, Sargent and Sims 1977). The long-term trend is growth of manufacturing at average 2.9 percent per year from May 1919 to May 2020. Growth at 2.9 percent per year would raise the NSA index of manufacturing output (SIC, Standard Industrial Classification) from 108.2987 in Dec 2007 to 154.4475 in May 2020. The actual index NSA in May 2020 is 87.3585 which is 43.4 percent below trend. The underperformance of manufacturing in May 2020 originates partly in the earlier global recession augmented by the current global recession with output in the US reaching a high in Feb 2020 (https://www.nber.org/cycles.html), in the lockdown of economic activity in the COVID-19. Manufacturing grew at the average annual rate of 3.3 percent between Dec 1986 and Dec 2006. Growth at 3.3 percent per year would raise the NSA index of manufacturing output (SIC, Standard Industrial Classification) from 108.2987 in Dec 2007 to 162.0699 in May 2020. The actual index NSA in May 2020 is 87.3585, which is 46.1 percent below trend. Manufacturing output grew at average 1.4 percent between Dec 1986 and May 2020. Using trend growth of 1.4 percent per year, the index would increase to 128.7047 in May 2020. The output of manufacturing at 87.3585 in May 2020 is 32.1 percent below trend under this alternative calculation. Using the NAICS (North American Industry Classification System), manufacturing output fell from the high of 110.5147 in Jun 2007 to the low of 86.3800 in Apr 2009 or 21.8 percent. The NAICS manufacturing index increased from 86.3800 in Apr 2009 to 88.2710 in May 2020 or 2.2 percent. The NAICS manufacturing index increased at the annual equivalent rate of 3.5 percent from Dec 1986 to Dec 2006. Growth at 3.5 percent would increase the NAICS manufacturing output index from 106.6777 in Dec 2007 to 163.5246 in May 2020. The NAICS index at 88.2710 in May 2020 is 46.0 below trend. The NAICS manufacturing output index grew at 1.7 percent annual equivalent from Dec 1999 to Dec 2006. Growth at 1.7 percent would raise the NAICS manufacturing output index from 106.6777 in Dec 2007 to 131.5151 in May 2020. The NAICS index at 88.2710 in May 2020 is 32.9 percent below trend under this alternative calculation.
Chart V-3A, United States Manufacturing NSA, Dec 2007 to May 2020
Board of Governors of the Federal Reserve System
https://www.federalreserve.gov/releases/g17/Current/default.htm
Chart V-3A, United States Manufacturing (NAICS) NSA, Jun 2007 to May 2020
Board of Governors of the Federal Reserve System
https://www.federalreserve.gov/releases/g17/Current/default.htm
Chart V-3B provides the civilian noninstitutional population of the United States, or those available for work. The civilian noninstitutional population increased from 231.713 million in Jun 2007 to 260.047 million in May 2020 or 28.334 million.
Chart V-3B, United States, Civilian Noninstitutional Population, Million, NSA, Jan 2007 to May 2020
Source: US Bureau of Labor Statistics
Chart V-3C provides nonfarm payroll manufacturing jobs in the United States from Jan 2007 to Apr 2020. Nonfarm payroll manufacturing jobs fell from 13.987 million in Jun 2007 to 11.677 million in May 2020, or 2.310 million.
Chart V-3C, United States, Payroll Manufacturing Jobs, NSA, Jan 2007 to May 2020, Thousands
Source: US Bureau of Labor Statistics
Chart V-3D provides the index of US manufacturing (NAICS) from Jan 1972 to May 2020. The index continued increasing during the decline of manufacturing jobs after the early 1980s. There are likely effects of changes in the composition of manufacturing with also changes in productivity and trade. There is sharp decline in the global recession, with output in the US reaching a high in Feb 2020 (https://www.nber.org/cycles.html), in the lockdown of economic activity in the COVID-19 event.
Chart V-3D, United States Manufacturing (NAICS) NSA, Jan 1972 to May 2020
Source: Board of Governors of the Federal Reserve System
https://www.federalreserve.gov/releases/g17/Current/default.htm
Chart V-3E provides the US noninstitutional civilian population, or those in condition of working, from Jan 1948, when first available, to May 2020. The noninstitutional civilian population increased from 170.042 million in Jun 1981 to 260.047 million in May 2020, or 90.005 million.
Chart V-3E, United States, Civilian Noninstitutional Population, Million, NSA, Jan 1948 to May 2020
Source: US Bureau of Labor Statistics
Chart V-3F provides manufacturing jobs in the United States from Jan 1939 to May 2020. Nonfarm payroll manufacturing jobs decreased from a peak of 18.890 million in Jun 1981 to 11.677 million in May 2020.
Chart V-3C, United States, Payroll Manufacturing Jobs, NSA, Jan 1939 to May 2020, Thousands
Source: US Bureau of Labor Statistics
Table V-3B, Germany, Manufacturing Orders and Manufacturing Output, ∆% Month and 12 Months
MFG New Orders Month ∆% | MFG New Orders 12 Months ∆% | MFG Output Month ∆% | MFG Output 12 Month ∆% | |
Apr 2020 | -25.8 | -36.7 | -22.0 | -31.2 |
Mar | -15.0 | -11.9 | -11.0 | -9.6 |
Feb | -1.2 | 0.7 | 0.4 | -4.1 |
Jan | 4.8 | -1.9 | 1.9 | -4.5 |
Dec 2019 | -1.5 | -7.1 | -1.5 | -4.5 |
Nov | -1.2 | -8.5 | 0.7 | -6.9 |
Oct | -0.4 | -5.4 | -1.2 | -5.6 |
Sep | 1.2 | -1.8 | -0.8 | -1.1 |
Aug | -0.4 | -9.0 | 0.2 | -7.4 |
Jul | -0.7 | -1.8 | -0.2 | -0.6 |
Jun | 1.4 | -11.0 | -1.2 | -14.4 |
May | -1.6 | -3.6 | 0.9 | 1.3 |
Apr | -0.7 | -5.2 | -2.6 | -3.9 |
Mar | 2.2 | -6.2 | 0.7 | -3.4 |
Feb | -3.8 | -7.2 | -0.1 | 0.1 |
Jan | -3.4 | -3.6 | -1.0 | -3.1 |
Dec 2018 | 1.5 | -8.2 | 1.1 | -6.7 |
Dec 2017 | 2.5 | 3.9 | -0.4 | 3.7 |
Dec 2016 | 4.4 | 11.2 | -1.6 | 2.0 |
Dec 2015 | -1.6 | -0.5 | 0.8 | 1.1 |
Source: Federal Statistical Agency of Germany, https://www.destatis.de/EN/Home/_node.html
Table V-3 provides the latest available estimates of GDP for the regions and countries followed in this blog from IQ2012 to IVQ2018 available now for all countries. There are estimates for all countries for IQ2019 and for IIQ2019 for most countries. There are preliminary estimates for most countries for IIIQ2019 and for IVQ2019. There are some estimates for IQ2020. Growth is weak throughout most of the world.
- Japan. The GDP of Japan increased 1.2 percent in IQ2012, 4.9 percent at SAAR (seasonally adjusted annual rate) and 3.1 percent relative to a year earlier but part of the jump could be the low level a year earlier because of the Tōhoku or Great East Earthquake and Tsunami of Mar 11, 2011. Japan is experiencing difficulties with the overvalued yen because of worldwide capital flight originating in zero interest rates with risk aversion in an environment of softer growth of world trade. Japan’s GDP fell 0.7 percent in IIQ2012 at the seasonally adjusted annual rate (SAAR) of minus 2.9 percent, which is much lower than 4.9 percent in IQ2012. Growth of 2.9 percent in IIQ2012 in Japan relative to IIQ2011 has effects of the low level of output because of Tōhoku or Great East Earthquake and Tsunami of Mar 11, 2011. Japan’s GDP contracted 0.4 percent in IIIQ2012 at the SAAR of minus 1.5 percent and decreased 0.1 percent relative to a year earlier. Japan’s GDP increased 0.3 percent in IVQ2012 at the SAAR of 1.1 percent and increased 0.3 percent relative to a year earlier. Japan grew 1.2 percent in IQ2013 at the SAAR of 5.0 percent and increased 0.4 percent relative to a year earlier. Japan’s GDP increased 0.8 percent in IIQ2013 at the SAAR of 3.1 percent and increased 1.9 percent relative to a year earlier. Japan’s GDP grew 0.8 percent in IIIQ2013 at the SAAR of 3.4 percent and increased 3.0 percent relative to a year earlier. In IVQ2013, Japan’s GDP changed 0.0 percent at the SAAR of minus 0.1 percent, increasing 2.7 percent relative to a year earlier. Japan’s GDP increased 1.0 percent in IQ2014 at the SAAR of 4.0 percent and increased 3.0 percent relative to a year earlier. In IIQ2014, Japan’s GDP fell 1.9 percent at the SAAR of minus 7.5 percent and fell 0.1 percent relative to a year earlier. Japan’s GDP increased 0.1 percent in IIIQ2014 at the SAAR of 0.4 percent and fell 0.9 percent relative to a year earlier. In IVQ2014, Japan’s GDP grew 0.5 percent, at the SAAR of 2.0 percent, decreasing 0.5 percent relative to a year earlier. The GDP of Japan increased 1.4 percent in IQ2015 at the SAAR of 5.6 percent and increased 0.0 percent relative to a year earlier. Japan’s GDP increased 0.1 percent in IIQ2015 at the SAAR of 0.4 percent and increased 2.2 percent relative to a year earlier. The GDP of Japan decreased 0.1 percent in IIIQ2015 at the SAAR of minus 0.2 percent and increased 1.9 percent relative to a year earlier. Japan’s GDP contracted 0.4 percent in IVQ2015 at the SAAR of minus 1.5 percent and grew 0.9 percent relative to a year earlier. In IQ2016, the GDP of Japan increased 0.5 percent at the SAAR of 2.0 percent and increased 0.2 percent relative to a year earlier. Japan’s GDP increased 0.1 percent in IIQ2016 at the SAAR of 0.6 percent and increased 0.2 percent relative to a year earlier. In IIIQ2016, the GDP of Japan increased 0.2 percent at the SAAR of 0.9 percent and increased 0.5 percent relative to a year earlier. Japan’s GDP increased 0.3 percent in IVQ2016 at the SAAR of 1.2 percent and increased 1.2 percent relative to a year earlier. In IQ2017, the GDP of Japan increased 1.2 percent at the SAAR of 4.7 percent and increased 1.8 percent relative to a year earlier. Japan’s GDP increased 0.4 percent in IIQ2017 at the SAAR of 1.4 percent and increased 1.9 percent relative to a year earlier. In IIIQ2017, the GDP of Japan increased 0.6 percent at the SAAR of 2.2 percent and increased 2.4 percent relative to a year earlier. Japan’s GDP increased 0.5 percent in IVQ2017, at the SAAR of 1.9 percent, and increased 2.5 percent relative to a year earlier. In IQ2018, the GDP of Japan decreased 0.5 percent, at the SAAR of minus 1.9 percent and increased 0.9 percent relative to a year earlier. Japan’s GDP increased 0.4 percent in IIQ2018, at the SAAR of 1.8 percent and increased 1.0 percent relative to a year earlier. In IIIQ2018, the GDP of Japan contracted 0.8 percent at the SAAR of minus 3.3 percent and decreased 0.3 percent relative to a year earlier. Japan’s GDP increased 0.6 percent in IVQ2018, at the SAAR of 2.3 percent and decreased 0.4 percent relative to a year earlier. In IQ2019, the GDP of Japan increased 0.6 percent at the SAAR of 2.6 percent and grew 0.8 percent relative to a year earlier. Japan’s GDP increased 0.5 percent in IIQ2019, at the SAAR of 2.1 percent and increased 0.9 percent relative to a year earlier. In IIIQ2019, the GDP of Japan changed 0.0 percent at the SAAR of 0.0 percent and increased 1.7 percent relative to a year earlier. Japan’s GDP decreased 1.9 percent in IVQ2019, at the SAAR of minus 7.2 percent and decreased 0.7 percent relative to a year earlier. In IQ2020, the GDP of Japan contracted 0.6 percent at the SAAR of minus 2.2 percent and decreased 1.7 percent relative to a year earlier.
- China. China’s GDP grew 1.9 percent in IQ2012, annualizing to 7.8 percent, and 8.1 percent relative to a year earlier. The GDP of China grew at 2.1 percent in IIQ2012, which annualizes to 8.7 percent, and 7.6 percent relative to a year earlier. China grew at 1.8 percent in IIIQ2012, which annualizes at 7.4 percent, and 7.5 percent relative to a year earlier. In IVQ2012, China grew at 2.0 percent, which annualizes at 8.2 percent, and 8.1 percent in IVQ2012 relative to IVQ2011. In IQ2013, China grew at 1.9 percent, which annualizes at 7.8 percent, and 7.9 percent relative to a year earlier. In IIQ2013, China grew at 1.8 percent, which annualizes at 7.4 percent, and 7.6 percent relative to a year earlier. China grew at 2.1 percent in IIIQ2013, which annualizes at 8.7 percent, and increased 7.9 percent relative to a year earlier. China grew at 1.6 percent in IVQ2013, which annualized to 6.6 percent, and 7.7 percent relative to a year earlier. China’s GDP grew 1.8 percent in IQ2014, which annualizes to 7.4 percent, and 7.5 percent relative to a year earlier. China’s GDP grew 1.8 percent in IIQ2014, which annualizes at 7.4 percent, and 7.6 percent relative to a year earlier. China’s GDP grew 1.8 percent in IIIQ2014, which is equivalent to 7.4 percent in a year, and 7.2 percent relative to a year earlier. The GDP of China grew 1.7 percent in IVQ2014, which annualizes at 7.0 percent, and 7.3 percent relative to a year earlier. The GDP of China grew at 1.8 percent in IQ2015, which annualizes at 7.4 percent, and 7.1 percent relative to a year earlier. The GDP of China grew 1.8 percent in IIQ2015, which annualizes at 7.4 percent, and increased 7.1 percent relative to a year earlier. In IIIQ2015, China’s GDP grew at 1.7 percent, which annualizes at 7.0 percent, and increased 7.0 percent relative to a year earlier. The GDP of China grew at 1.6 percent in IVQ2015, which annualizes at 6.6 percent, and increased 6.9 percent relative to a year earlier. The GDP of China grew 1.5 percent in IQ2016, which annualizes at 6.1 percent, and increased 6.9 percent relative to a year earlier. In IIQ2016, the GDP of China increased 1.8 percent, which annualizes to 7.4 percent, and increased 6.8 percent relative to a year earlier. The GDP of China increased at 1.7 percent in IIIQ2016, which annualizes at 7.0 percent, and increased 6.8 percent relative to a year earlier. The GDP of China increased at 1.6 percent in IVQ2016, which annualizes at 6.6 percent, and increased 6.9 percent relative to a year earlier. The GDP of China increased at 1.7 percent in IQ2017, which annualizes at 7.0 percent and increased 7.0 percent relative to a year earlier. China’s GDP increased at 1.8 percent in IIQ2017, which annualizes at 7.4 percent, and increased 7.0 percent relative to a year earlier. The GDP of China increased 1.6 percent in IIIQ2017, which annualizes at 6.6 percent, and increased 6.9 percent relative to a year earlier. China’s GDP increased at 1.5 percent in IVQ2017, which annualizes at 6.1 percent, and increased 6.8 percent relative to a year earlier. The GDP of China grew at 1.7 percent in IQ2018, which annualizes to 7.0 percent, and increased 6.9 percent relative to a year earlier. China’s GDP increased at 1.7 percent in IIQ2018, which annualizes at 7.0 percent, and increased 6.9 percent relative to a year earlier. The GDP of China grew at 1.5 percent in IIIQ2018, which annualizes to 6.1 percent, and increased 6.7 percent relative to a year earlier. China’s GDP increased 1.5 percent in IVQ2018, which annualized at 6.1 percent, and increased 6.5 percent relative to a year earlier. The GDP of China grew at 1.6 percent in IQ2019, which annualizes at 6.6 percent and increased 6.4 percent relative to a year earlier. China’s GDP increased 1.5 percent in IIQ2019, which annualized at 6.1 percent, and increased 6.2 percent relative to a year earlier. The GDP of China grew at 1.3 percent in IIIQ2019, which annualizes at 5.3 percent and increased 6.0 percent relative to a year earlier. China’s GDP grew 1.5 percent in IVQ2019, which annualizes at 6.1 percent, and grew 6.0 percent relative to a year earlier. The GDP of China contracted at 9.8 percent in IQ2020, which annualizes at minus 71.0 percent, and decreased 6.8 percent relative to a year earlier. There was decennial change in leadership in China (http://www.xinhuanet.com/english/special/18cpcnc/index.htm). Xi Jinping initiated a second term of leadership in Oct 2017 (http://news.xinhuanet.com/english/2017-10/25/c_136705344.htm). Growth rates of GDP of China in a quarter relative to the same quarter a year earlier have been declining from 2011 to 2020.
- Euro Area. GDP fell 0.2 percent in the euro area in IQ2012 and decreased 0.5 in IQ2012 relative to a year earlier. Euro area GDP contracted 0.3 percent IIQ2012 and fell 0.8 percent relative to a year earlier. In IIIQ2012, euro area GDP fell 0.1 percent and declined 1.0 percent relative to a year earlier. In IVQ2012, euro area GDP fell 0.4 percent relative to the prior quarter and fell 1.1 percent relative to a year earlier. In IQ2013, the GDP of the euro area fell 0.4 percent and decreased 1.2 percent relative to a year earlier. The GDP of the euro area increased 0.5 percent in IIQ2013 and fell 0.4 percent relative to a year earlier. In IIIQ2013, euro area GDP increased 0.3 percent and changed 0.0 percent relative to a year earlier. The GDP of the euro area increased 0.3 percent in IVQ2013 and increased 0.7 percent relative to a year earlier. In IQ2014, the GDP of the euro area increased 0.5 percent and increased 1.6 percent relative to a year earlier. The GDP of the euro area increased 0.2 percent in IIQ2014 and increased 1.2 percent relative to a year earlier. The euro area’s GDP increased 0.5 percent in IIIQ2014 and increased 1.4 percent relative to a year earlier. The GDP of the euro area increased 0.4 percent in IVQ2014 and increased 1.6 percent relative to a year earlier. Euro area GDP increased 0.7 percent in IQ2015 and increased 1.8 percent relative to a year earlier. The GDP of the euro area increased 0.4 percent in IIQ2015 and increased 2.1 percent relative to a year earlier. The euro area’s GDP increased 0.4 percent in IIIQ2015 and increased 2.0 percent relative to a year earlier. Euro area GDP increased 0.4 percent in IVQ2015 and increased 2.0 percent relative to a year earlier. Euro area’s GDP increased 0.6 percent in IQ2016 and increased 1.9 percent relative to a year earlier. The GDP of the euro area increased 0.3 percent in IIQ2016 and increased 1.8 percent relative to a year earlier. In IIIQ2016, the GDP of the euro area increased 0.4 percent and increased 1.8 percent relative to a year earlier. The GDP of the euro area increased 0.8 percent in IVQ2016 and increased 2.1 percent relative to a year earlier. In IQ2017, euro area GDP increased 0.7 percent and increased 2.2 percent relative to a year earlier. The GDP of the euro area increased 0.7 percent in IIQ2017 and increased 2.6 percent relative to a year earlier. In IIIQ2017, the GDP of the euro area increased 0.8 percent and grew 2.9 percent relative to a year earlier. The GDP of the euro area grew 0.8 percent in IVQ2017 and increased 3.0 percent relative to a year earlier. In IQ2018, the GDP of the euro area increased 0.2 percent and grew 2.6 percent relative to a year earlier. The GDP of the euro area grew 0.4 percent in IIQ2018 and increased 2.2 percent relative to a year earlier. In IIIQ2018, the GDP of the euro area increased 0.2 percent and increased 1.6 percent relative to a year earlier. The GDP of the euro area increased 0.4 percent in IVQ2018 and increased 1.2 percent relative to a year earlier. In IQ2019, the GDP of the euro area increased 0.5 percent and increased 1.5 percent relative to a year earlier. The GDP of the euro area increased 0.1 percent in IIQ2019 and increased 1.2 percent relative to a year earlier. In IIIQ2019, the GDP of the euro area increased 0.3 percent and increased 1.3 percent relative to a year earlier. The GDP of the euro area increased 0.1 percent in IVQ2019 and increased 1.0 percent relative to a year earlier. In IQ2020, the GDP of the euro area decreased 3.6 percent and decreased 3.1 percent relative to a year earlier.
- Germany. The GDP of Germany increased 0.2 percent in IQ2012 and increased 1.5 percent relative to a year earlier but 1.0 percent relative to a year earlier when adjusted for calendar effects (CA). In IIQ2012, Germany’s GDP increased 0.2 percent and increased 0.4 percent relative to a year earlier but 0.9 percent relative to a year earlier when adjusted for calendar effects (CA). In IIIQ2012, Germany’s GDP increased 0.3 percent and decreased 0.1 percent relative to a year earlier. Germany’s GDP contracted 0.4 percent in IVQ2012 and decreased 0.1 percent relative to a year earlier. In IQ2013, Germany’s GDP decreased 0.5 percent and fell 1.5 percent relative to a year earlier. In IIQ2013, Germany’s GDP increased 1.1 percent and grew 0.8 percent relative to a year earlier. The GDP of Germany increased 0.5 percent in IIIQ2013 and grew 1.2 percent relative to a year earlier. In IVQ2013, Germany’s GDP increased 0.3 percent and increased 1.2 percent relative to a year earlier. The GDP of Germany increased 1.0 percent in IQ2014 and grew 3.2 percent relative to a year earlier. In IIQ2014, Germany’s GDP changed 0.0 percent and increased 1.4 percent relative to a year earlier. The GDP of Germany increased 0.5 percent in IIIQ2014 and increased 1.8 percent relative to a year earlier. Germany’s GDP increased 0.9 percent in IVQ2014 and increased 2.4 percent relative to a year earlier. The GDP of Germany decreased 0.2 percent in IQ2015 and increased 1.3 percent relative to a year earlier. Germany’s GDP increased 0.6 percent in IIQ2015 and grew 1.8 percent relative to a year earlier. The GDP of Germany increased 0.5 percent in IIIQ2015 and grew 1.8 percent relative to a year earlier. Germany’s GDP increased 0.4 percent in IVQ2015 and grew 2.1 percent relative to a year earlier. In IQ2016, the GDP of Germany increased 0.8 percent and grew 2.0 percent relative to a year earlier. Germany’s GDP increased 0.6 percent in IIQ2016 and increased 3.7 percent relative to a year earlier. In IIIQ2016, the GDP of Germany increased 0.2 percent and grew 1.9 percent relative to a year earlier. Germany’s GDP increased 0.4 percent in IVQ2016 and grew 1.4 percent relative to a year earlier. In IQ2017, the GDP of Germany increased 1.2 percent and grew 3.6 percent relative to a year earlier. Germany’s GDP increased 0.6 percent in IIQ2017 and grew 1.0 percent relative to a year earlier and 2.3 percent relative to a year earlier adjusting for calendar effects (CA). In IIIQ2017, the GDP of Germany increased 0.9 percent and increased 2.5 percent relative to a year earlier and 3.0 percent relative to a year earlier (CA). Germany’s GDP increased 0.7 percent in IVQ2017, 2.8 percent relative to a year earlier and 3.4 percent relative to a year earlier (CA). The GDP of Germany increased 0.1 percent in IQ2018 and grew 1.6 percent relative to a year earlier and 2.3 percent relative to a year earlier (CA). Germany’s GDP increased 0.4 percent in IIQ2018, 2.5 percent relative to a year earlier and 2.1 relative to a year earlier (CA). The GDP of Germany decreased 0.1 percent in IIIQ2018, increasing 1.1 percent relative to a year earlier and 1.1 percent relative to a year earlier (CA). Germany’s GDP changed 0.2 percent in IVQ2018, increasing 0.9 percent relative to a year earlier and 0.6 relative to a year earlier (CA). The GDP of Germany increased 0.5 percent in IQ2019, increasing 0.9 percent relative to a year earlier and increasing 1.0 percent relative to a year earlier (CA). Germany’s GDP contracted 0.2 percent in IIQ2019, decreased 0.1 percent relative to a year earlier and increased 0.3 relative to a year earlier (CA). The GDP of Germany increased 0.3 percent in IIIQ2019, increasing 1.2 percent relative to a year earlier and increasing 0.7 percent relative to a year earlier (CA). Germany’s GDP decreased 0.1 percent in IVQ2019, increased 0.2 percent relative to a year earlier and increased 0.4 percent relative to a year earlier (CA). The GDP of Germany contracted 2.2 percent in IQ2020, decreasing 1.9 percent relative to a year earlier and decreasing 2.3 percent relative to a year earlier (CA).
- United States. Growth of US GDP in IQ2012 was 0.8 percent, at SAAR of 3.2 percent and higher by 2.7 percent relative to IQ2011. US GDP increased 0.4 percent in IIQ2012, 1.7 percent at SAAR and 2.4 percent relative to a year earlier. In IIIQ2012, US GDP grew 0.1 percent, 0.5 percent at SAAR and 2.5 percent relative to IIIQ2011. In IVQ2012, US GDP grew 0.1 percent, 0.5 percent at SAAR and 1.5 percent relative to IVQ2011. In IQ2013, US GDP grew at 3.6 percent SAAR, 0.9 percent relative to the prior quarter and 1.6 percent relative to the same quarter in 2012. In IIQ2013, US GDP grew at 0.5 percent in SAAR, 0.1 percent relative to the prior quarter and 1.3 percent relative to IIQ2012. US GDP grew at 3.2 percent in SAAR in IIIQ2013, 0.8 percent relative to the prior quarter and 1.9 percent relative to the same quarter a year earlier (https://cmpassocregulationblog.blogspot.com/2020/05/mediocre-cyclical-united-states_31.html and earlier https://cmpassocregulationblog.blogspot.com/2020/05/mediocre-cyclical-united-states.html). In IVQ2013, US GDP grew 0.8 percent at 3.2 percent SAAR and 2.6 percent relative to a year earlier. In IQ2014, US GDP decreased 0.3 percent, increased 1.4 percent relative to a year earlier and fell 1.1 percent at SAAR. In IIQ2014, US GDP increased 1.4 percent at 5.5 percent SAAR and increased 2.7 percent relative to a year earlier. US GDP increased 1.2 percent in IIIQ2014 at 5.0 percent SAAR and increased 3.1 percent relative to a year earlier. In IVQ2014, US GDP increased 0.6 percent at SAAR of 2.3 percent and increased 2.9 percent relative to a year earlier. GDP increased 0.8 percent in IQ2015 at SAAR of 3.2 percent and grew 4.0 percent relative to a year earlier. US GDP grew at SAAR of 3.0 percent in IIQ2015, increasing 0.7 percent in the quarter and 3.4 percent relative to a year earlier. GDP increased 0.3 percent in IIIQ2015 at SAAR of 1.3 percent and grew 2.4 percent in IIIQ2015 relative to a year earlier. US GDP grew at SAAR of 0.1 percent in IVQ2015, increasing 0.0 percent in the quarter and 1.9 percent relative to a year earlier. In IQ2016, US GDP grew 0.5 percent at SAAR of 2.0 percent and increased 1.6 percent relative to a year earlier. US GDP grew at SAAR of 1.9 percent in IIQ2016, increasing 0.5 percent in the quarter and 1.3 percent relative to a year earlier. In IIIQ2016, US GDP grew 0.5 percent at SAAR of 2.2 percent and increased 1.6 percent relative to a year earlier. US GDP grew at SAAR of 2.0 percent in IVQ2016, increasing 0.5 percent in the quarter, and increasing 2.0 percent relative to a year earlier. In IQ2017, US GDP grew 0.6 percent at SAAR of 2.3 percent and increased 2.1 percent relative to a year earlier. US GDP grew at SAAR of 2.2 percent in IIQ2017, increasing 0.5 percent in the quarter, and increasing 2.2 percent relative to a year earlier. In IIIQ2017, US GDP grew 0.8 percent at SAAR of 3.2 percent and increased 2.4 percent relative to a year earlier. US GDP grew at SAAR of 3.5 percent in IVQ2017, increasing 0.9 percent in the quarter, and increasing 2.8 percent relative to a year earlier. In IQ2018, US GDP grew at SAAR of 2.5 percent, increasing 0.6 percent in the quarter, and increasing 2.9 percent relative to a year earlier. US GDP grew at SAAR of 3.5 percent in IIQ2018, increasing 0.9 percent in the quarter, and increasing 3.2 percent relative to a year earlier. In IIIQ2018, US GDP grew at SAAR of 2.9 percent, increasing 0.7 percent in the quarter, and increasing 3.1 percent relative to a year earlier. US GDP grew at SAAR of 1.1 percent in IVQ2018, increasing 0.3 percent in the quarter, and increasing 2.5 percent relative to a year earlier. In IQ2019, US GDP grew at SAAR of 3.1 percent, increasing 0.8 percent in the quarter and increasing 2.7 percent relative to a year earlier. US GDP grew at SAAR of 2.0 percent in IIQ2019, increasing 0.5 percent in the quarter, and increasing 2.3 percent relative to a year earlier. In IIIQ2019, US GDP grew at SAAR of 2.1 percent, increasing 0.5 percent in the quarter, and increasing 2.1 percent relative to a year earlier. US GDP grew at SAAR of 2.1 percent in IVQ2019, increasing 0.5 percent in the quarter, and increasing 2.3 percent relative to a year earlier. In IQ2020, US GDP contracted at SAAR of minus 5.0 percent, decreasing 1.3 percent in the quarter, and increasing 0.2 percent relative to a year earlier.
- United Kingdom. In IQ2012, UK GDP increased 0.6 percent and increased 1.2 percent relative to a year earlier. In IIQ2012, GDP fell 0.1 percent relative to IQ2012 and increased 1.1 percent relative to a year earlier. In IIIQ2012, GDP increased 1.2 percent and increased 2.0 percent relative to the same quarter a year earlier. In IVQ2012, GDP fell 0.2 percent and increased 1.6 percent relative to a year earlier. Fiscal consolidation in an environment of weakening economic growth is much more challenging. GDP increased 1.6 percent in IQ2013 relative to a year earlier and 0.6 percent in IQ2013 relative to IVQ2012. In IIQ2013, GDP increased 0.5 percent and 2.3 percent relative to a year earlier. GDP increased 0.9 percent in IIIQ2013 and 2.0 percent relative to a year earlier. GDP increased 0.5 percent in IVQ2013 and 2.7 percent relative to a year earlier. In IQ2014, GDP increased 0.7 percent and 2.7 percent relative to a year earlier. GDP increased 0.7 percent in IIQ2014 and 2.8 percent relative to a year earlier. GDP increased 0.6 percent in IIIQ2014 and 2.4 percent relative to a year earlier. In IVQ2014, GDP increased 0.6 percent and 2.5 percent relative to a year earlier. GDP increased 0.5 percent in IQ2015 and increased 2.3 percent relative to a year earlier. GDP increased 0.7 percent in IIQ2015 and increased 2.4 percent relative to a year earlier. UK GDP increased 0.4 percent in IIIQ2015 and increased 2.2 percent relative to a year earlier. GDP increased 0.7 percent in IVQ2015 and increased 2.4 percent relative to a year earlier. GDP increased 0.2 percent in IQ2016 and increased 2.1 percent relative to a year earlier. GDP increased 0.5 percent in IIQ2016 and grew 1.9 percent relative to a year earlier. UK GDP increased 0.5 percent in IIIQ2016 and increased 1.9 percent relative to a year earlier. GDP increased 0.6 percent in IVQ2016 and increased 1.8 percent relative to a year earlier. UK GDP increased 0.6 percent in IQ2017 and increased 2.2 percent relative to a year earlier. GDP increased 0.3 percent in IIQ2017 and increased 1.9 percent relative to a year earlier. In IIIQ2017, GDP increased 0.3 percent and increased 1.8 percent relative to a year earlier. GDP increased 0.4 percent in IVQ2017 and increased 1.6 percent relative to a year earlier. In IQ2018, GDP increased 0.1 percent and increased 1.1 percent relative to a year earlier. GDP increased 0.5 percent in IIQ2018 and increased 1.3 percent relative to a year earlier. In IIIQ2018, GDP increased 0.6 percent and increased 1.6 percent relative to a year earlier. GDP increased 0.2 percent in IVQ2018 and increased 1.4 percent relative to a year earlier. In IQ2019, GDP increased 0.7 percent and increased 2.0 percent relative to a year earlier. GDP decreased 0.2 percent in IIQ2019 and increased 1.3 percent relative to a year earlier. In IIIQ2019, GDP increased 0.5 percent and increased 1.3 percent relative to a year earlier. GDP changed 0.0 percent in IVQ2019 and increased 1.1 percent relative to a year earlier. In IQ2020, GDP decreased 2.0 percent and decreased 1.6 percent relative to a year earlier.
- Italy. Italy’s GDP contracted 5.3 percent in IQ2020 and contracted 5.4 percent relative to a year earlier in the global recession of the lockdown of economic activity in the COVID-19 event. In IVQ2019, the GDP of Italy decreased 0.2 percent and increased 0.1 percent relative to a year earlier. Italy’s GDP changed 0.0 percent in IIIQ2019 and increased 0.5 percent relative to a year earlier. In IIQ2019, Italy’s GDP increased 0.1 percent and increased 0.4 percent relative to a year earlier. Italy’s GDP increased 0.2 percent in IQ2019 and increased 0.3 percent relative to a year earlier. In IVQ2018, the GDP of Italy increased 0.2 percent and increased 0.1 percent relative to a year earlier. Italy’s GDP decreased 0.1 percent in IIIQ2018 and increased 0.4 percent relative to a year earlier. In IIQ2018, the GDP of Italy changed 0.0 percent and increased 0.9 percent relative to a year earlier. Italy’s GDP changed 0.0 percent in IQ2018 and increased 1.3 percent relative to a year earlier. In IVQ2017, the GDP of Italy increased 0.5 percent and increased 1.9 percent relative to a year earlier. Italy’s GDP increased 0.4 percent in IIIQ2017 and increased 1.6 percent relative to a year earlier. In IIQ2017, the GDP of Italy increased 0.4 percent and increased 1.8 percent relative to a year earlier. Italy’s GDP increased 0.6 percent in IQ2017 and increased 1.6 percent relative to a year earlier. In IVQ2016, the GDP of Italy increased 0.3 percent and increased 1.4 percent relative to a year earlier. Italy’s GDP increased 0.5 percent in IIIQ2016 and increased 1.6 percent relative to a year earlier. In IIQ2016, GDP increased 0.2 percent and increased 1.2 percent relative to a year earlier. GDP increased 0.3 percent in IQ2016 and increased 1.5 percent relative to a year earlier. GDP increased 0.5 percent in IVQ2015 and increased 1.3 percent relative to a year earlier. In IIIQ2015, GDP increased 0.2 percent and increased 0.6 percent relative to a year earlier. GDP increased 0.4 percent in IIQ2015 and 0.5 percent relative to a year earlier. GDP increased 0.2 percent in IQ2015 and increased 0.1 percent relative to a year earlier. GDP decreased 0.2 percent in IVQ2014 and changed 0.0 percent relative to a year earlier. GDP increased 0.1 percent in IIIQ2014 and changed 0.0 percent relative to a year earlier. Italy’s GDP changed 0.0 percent in IIQ2014 and increased 0.1 percent relative to a year earlier. The GDP of Italy increased 0.1 percent in IQ2014 and increased 0.1 percent relative to a year earlier. Italy’s GDP decreased 0.2 percent in IVQ2013 and fell 0.9 percent relative to a year earlier. The GDP of Italy increased 0.2 percent in IIIQ2013 and fell 1.5 percent relative to a year earlier. Italy’s GDP changed 0.0 percent in IIQ2013 and fell 2.2 percent relative to a year earlier. Italy’s GDP fell 0.8 percent in IQ2013 and declined 2.9 percent relative to IQ2013. GDP had been growing during six consecutive quarters but at very low rates from IQ2010 to IIQ2011. Italy’s GDP fell in seven consecutive quarters from IIIQ2011 to IQ2013 at increasingly higher rates of contraction from 0.5 percent in IIIQ2011 to 0.9 percent in IVQ2011, 1.1 percent in IQ2012, 0.8 percent in IIQ2012 and 0.5 percent in IIIQ2012. The pace of decline accelerated to minus 0.8 percent in IVQ2012 and minus 0.8 percent in IQ2013. GDP contracted cumulatively 5.3 percent in seven consecutive quarterly contractions from IIIQ2011 to IQ2013 at the annual equivalent rate of minus 3.1 percent. The year-on-year rate has fallen from 2.2 percent in IVQ2010 to minus 3.2 percent in IVQ2012, minus 2.9 percent in IQ2013, minus 2.2 percent in IIQ2013 and minus 1.5 percent in IIIQ2013. GDP fell 0.9 percent in IVQ2013 relative to a year earlier. GDP increased 0.1 percent in IQ2014 relative to a year earlier and increased 0.1 percent in IIQ2014 relative to a year earlier. GDP changed 0.0 percent in IIIQ2014 relative to a year earlier and changed 0.0 percent in IVQ2014 relative to a year earlier. GDP increased 0.1 percent in IQ2015 relative to a year earlier and increased 0.5 percent in IIQ2015 relative to a year earlier. GDP increased 0.6 percent in IIIQ2015 relative to a year earlier and increased 1.3 percent in IVQ2015 relative to a year earlier. GDP increased 1.5 percent in IQ2016 relative to a year earlier and increased 1.2 percent in IIQ2016 relative to a year earlier. GDP increased 1.6 percent in IIIQ2016 relative to a year earlier and increased 1.4 percent in IVQ2016 relative to a year earlier. GDP increased 1.6 percent in IQ2017 relative to a year earlier and increased 1.8 percent in IIQ2017 relative to a year earlier. GDP increased 1.6 percent in IIIQ2017 relative to a year earlier and increased 1.9 percent in IVQ2017 relative to a year earlier. GDP increased 1.3 percent in IQ2018 relative to a year earlier and increased 0.9 percent in IIQ2018 relative to a year earlier. GDP increased 0.4 percent in IIIQ2018 relative to a year earlier and increased 0.1 percent in IVQ2018 relative to a year earlier. GDP increased 0.3 percent in IQ2019 relative to a year earlier and increased 0.4 percent in IIQ2019 relative to a year earlier. GDP increased 0.5 percent in IIIIQ2019 relative to a year earlier and increased 0.1 percent in IVQ2019 relative to a year earlier. GDP contracted 5.4 percent in IQ2020 relative to a year earlier. Using seasonally and calendar adjusted chained volumes in the dataset of EUROSTAT (https://ec.europa.eu/eurostat/), the GDP of Italy in IVQ2019 of €407,308.2 million (https://www.istat.it/it/archivio/243606) is lower by 10.0 percent relative to €452,802.5 million in IQ2008 (https://ec.europa.eu/eurostat/). Using seasonally and calendar adjusted chained volumes in the dataset of EUROSTAT (https://ec.europa.eu/eurostat/), the GDP of Italy increased from €392,018.4 million in IQ1998 to €452,802.5 million in IQ2008 at the annual equivalent rate of 1.5 percent. The fiscal adjustment of Italy is significantly more difficult with the economy not growing especially on the prospects of increasing government revenue. The strategy is for reforms to improve productivity, facilitating future fiscal consolidation.
- France. France’s GDP increased 0.1 percent in IQ2012 and increased 0.7 percent relative to a year earlier. France’s GDP decreased 0.2 percent in IIQ2012 and increased 0.5 percent relative to a year earlier. In IIIQ2012, France’s GDP increased 0.2 percent and increased 0.3 percent relative to a year earlier. France’s GDP decreased 0.1 percent in IVQ2012 and changed 0.0 percent relative to a year earlier. In IQ2013, France’s GDP changed 0.0 percent and decreased 0.1 percent relative to a year earlier. The GDP of France increased 0.7 percent in IIQ2013 and increased 0.8 percent relative to a year earlier. France’s GDP changed 0.0 percent in IIIQ2013 and increased 0.6 percent relative to a year earlier. The GDP of France increased 0.5 percent in IVQ2013 and increased 1.2 percent relative to a year earlier. In IQ2014, France’s GDP increased 0.1 percent and increased 1.3 percent relative to a year earlier. In IIQ2014, France’s GDP increased 0.1 percent and increased 0.7 percent relative to a year earlier. France’s GDP increased 0.5 percent in IIIQ2014 and increased 1.2 percent relative to a year earlier. The GDP of France increased 0.1 percent in IVQ2014 and increased 0.8 percent relative to a year earlier. France’s GDP increased 0.5 percent in IQ2015 and increased 1.2 percent relative to a year earlier. In IIQ2015, France’s GDP decreased 0.1 percent and increased 1.1 percent relative to a year earlier. France’s GDP increased 0.3 percent in IIIQ2015 and increased 0.9 percent relative to a year earlier. In IVQ2015, the GDP of France increased 0.1 percent and increased 0.9 percent relative to a year earlier. France’s GDP increased 0.7 percent in IQ2016 and increased 1.1 percent relative to a year earlier. The GDP of France decreased 0.2 percent in IIQ2016 and increased 0.9 percent relative to a year earlier. France’s GDP increased 0.2 percent in IIIQ2016 and increased 0.8 percent relative to a year earlier. In IVQ2016, the GDP of France increased 0.6 percent and increased 1.3 percent relative to a year earlier. France’s GDP increased 0.8 percent in IQ2017 and increased 1.4 percent relative to a year earlier. In IIQ2017, the GDP of France increased 0.7 percent and increased 2.4 percent relative to a year earlier. France’s GDP increased 0.7 percent in IIIQ2017 and increased 2.8 percent relative to a year earlier. In IVQ2017, the GDP of France increased 0.8 percent and increased 3.1 percent relative to a year earlier. France’s GDP increased 0.2 percent in IQ2018 and increased 2.4 percent relative to a year earlier. In IIQ2018, the GDP of France increased 0.2 percent and increased 1.9 percent relative to a year earlier. France’s GDP increased 0.3 percent in IIIQ2018 and increased 1.6 percent relative to a year earlier. In IVQ2018, the GDP of France increased 0.6 percent and increased 1.3 percent relative to a year earlier. France’s GDP increased 0.5 percent in IQ2019 and increased 1.7 percent relative to a year earlier. In IIQ2019, the GDP of France increased 0.3 percent and increased 1.8 percent relative to a year earlier. France’s GDP increased 0.2 percent in IIIQ2019 and increased 1.6 percent relative to a year earlier. In IVQ2019, the GDP of France decreased 0.1 percent and increased 0.9 percent relative to a year earlier. France’s GDP decreased 5.3 percent in IQ2020 and decreased 5.0 percent relative to a year earlier.
Table V-3, Percentage Changes of GDP Quarter on Prior Quarter and on Same Quarter Year Earlier, ∆%
IQ2012/IVQ2011 | IQ2012/IQ2011 | |
USA | QOQ: 0.8 SAAR: 3.2 | 2.7 |
Japan | QOQ: 1.2 SAAR: 4.9 | 3.1 |
China | 1.9 AE 7.8 | 8.1 |
Euro Area | -0.2 | -0.5 |
Germany | 0.2 | 1.5 CA 1.0 |
France | 0.1 | 0.7 |
Italy | -1.1 | -2.3 |
United Kingdom | 0.6 | 1.2 |
IIQ2012/IQ2012 | IIQ2012/IIQ2011 | |
USA | QOQ: 0.4 SAAR: 1.7 | 2.4 |
Japan | QOQ: -0.7 | 2.9 |
China | 2.1 AE 8.7 | 7.6 |
Euro Area | -0.3 | -0.8 |
Germany | 0.2 | 0.4 CA 0.9 |
France | -0.2 | 0.5 |
Italy | -0.8 | -3.2 |
United Kingdom | -0.1 | 1.1 |
IIIQ2012/ IIQ2012 | IIIQ2012/ IIIQ2011 | |
USA | QOQ: 0.1 | 2.5 |
Japan | QOQ: –0.4 | -0.1 |
China | 1.8 AE 7.4 | 7.5 |
Euro Area | -0.1 | -1.0 |
Germany | 0.3 | -0.1 |
France | 0.2 | 0.3 |
Italy | -0.5 | -3.3 |
United Kingdom | 1.2 | 2.0 |
IVQ2012/IIIQ2012 | IVQ2012/IVQ2011 | |
United States | QOQ: 0.1 | 1.5 |
Japan | QOQ: 0.3 SAAR: 1.1 | 0.3 |
China | 2.0 AE 8.2 | 8.1 |
Euro Area | -0.4 | -1.1 |
Germany | -0.4 | -0.1 |
France | -0.1 | 0.0 |
Italy | -0.8 | -3.2 |
United Kingdom | -0.2 | 1.6 |
IQ2013/IVQ2012 | IQ2013/IQ2012 | |
United States | QOQ: 0.9 | 1.6 |
Japan | QOQ: 1.2 SAAR: 5.0 | 0.4 |
China | 1.9 AE 7.8 | 7.9 |
Euro Area | -0.4 | -1.2 |
Germany | -0.5 | -1.5 |
France | 0.0 | -0.1 |
Italy | -0.8 | -2.9 |
UK | 0.6 | 1.6 |
IIQ2013/IQ2013 | IIQ2013/IIQ2012 | |
USA | QOQ: 0.1 SAAR: 0.5 | 1.3 |
Japan | QOQ: 0.8 SAAR: 3.1 | 1.9 |
China | 1.8 AE 7.4 | 7.6 |
Euro Area | 0.5 | -0.4 |
Germany | 1.1 | 0.8 |
France | 0.7 | 0.8 |
Italy | 0.0 | -2.2 |
UK | 0.5 | 2.3 |
IIIQ2013/IIQ2013 | III/Q2013/IIIQ2012 | |
USA | QOQ: 0.8 | 1.9 |
Japan | QOQ: 0.8 SAAR: 3.4 | 3.0 |
China | 2.1 AE 8.7 | 7.9 |
Euro Area | 0.3 | 0.0 |
Germany | 0.5 | 1.2 |
France | 0.0 | 0.6 |
Italy | 0.2 | -1.5 |
UK | 0.9 | 2.0 |
IVQ2013/IIIQ2013 | IVQ2013/IVQ2012 | |
USA | QOQ: 0.8 SAAR: 3.2 | 2.6 |
Japan | QOQ: 0.0 SAAR: -0.1 | 2.7 |
China | 1.6 AE 6.6 | 7.7 |
Euro Area | 0.3 | 0.7 |
Germany | 0.3 | 1.2 |
France | 0.5 | 1.2 |
Italy | -0.2 | -0.9 |
UK | 0.5 | 2.7 |
IQ2014/IVQ2013 | IQ2014/IQ2013 | |
USA | QOQ -0.3 SAAR -1.1 | 1.4 |
Japan | QOQ: 1.0 SAAR: 4.0 | 3.0 |
China | 1.8 AE 7.4 | 7.5 |
Euro Area | 0.5 | 1.6 |
Germany | 1.0 | 3.2 |
France | 0.1 | 1.3 |
Italy | 0.1 | 0.1 |
UK | 0.7 | 2.7 |
IIQ2014/IQ2014 | IIQ2014/IIQ2013 | |
USA | QOQ 1.4 SAAR 5.5 | 2.7 |
Japan | QOQ: -1.9 SAAR: -7.5 | -0.1 |
China | 1.8 AE 7.4 | 7.6 |
Euro Area | 0.2 | 1.2 |
Germany | 0.0 | 1.4 |
France | 0.1 | 0.7 |
Italy | 0.0 | 0.1 |
UK | 0.7 | 2.8 |
IIIQ2014/IIQ2014 | IIIQ2014/IIIQ2013 | |
USA | QOQ: 1.2 SAAR: 5.0 | 3.1 |
Japan | QOQ: 0.1 SAAR: 0.4 | -0.9 |
China | 1.8 AE 7.4 | 7.2 |
Euro Area | 0.5 | 1.4 |
Germany | 0.5 | 1.8 |
France | 0.5 | 1.2 |
Italy | 0.1 | 0.0 |
UK | 0.6 | 2.4 |
IVQ2014/IIIQ2014 | IVQ2014/IVQ2013 | |
USA | QOQ: 0.6 SAAR: 2.3 | 2.9 |
Japan | QOQ: 0.5 SAAR: 2.0 | -0.5 |
China | 1.7 AE 7.0 | 7.3 |
Euro Area | 0.4 | 1.6 |
Germany | 0.9 | 2.4 |
France | 0.1 | 0.8 |
Italy | -0.2 | 0.0 |
UK | 0.6 | 2.5 |
IQ2015/IVQ2014 | IQ2015/IQ2014 | |
USA | QOQ: 0.8 SAAR: 3.2 | 4.0 |
Japan | QOQ: 1.4 SAAR: 5.6 | 0.0 |
China | 1.8 AE 7.4 | 7.1 |
Euro Area | 0.7 | 1.8 |
Germany | -0.2 | 1.3 |
France | 0.5 | 1.2 |
Italy | 0.2 | 0.1 |
UK | 0.5 | 2.3 |
IIQ2015/IQ2015 | IIQ2015/IIQ2014 | |
USA | QOQ: 0.7 SAAR: 3.0 | 3.4 |
Japan | QOQ: 0.1 SAAR: 0.4 | 2.2 |
China | 1.8 AE 7.4 | 7.1 |
Euro Area | 0.4 | 2.1 |
Germany | 0.6 | 1.8 |
France | -0.1 | 1.1 |
Italy | 0.4 | 0.5 |
UK | 0.7 | 2.4 |
IIIQ2015/IIQ2015 | IIIQ2015/IIIQ2014 | |
USA | QOQ: 0.3 SAAR: 1.3 | 2.4 |
Japan | QOQ: -0.1 SAAR: -0.2 | 1.9 |
China | 1.7 AE 7.0 | 7.0 |
Euro Area | 0.4 | 2.0 |
Germany | 0.5 | 1.8 |
France | 0.3 | 0.9 |
Italy | 0.2 | 0.6 |
UK | 0.4 | 2.2 |
IVQ2015/IIIQ2015 | IVQ2015/IVQ2014 | |
USA | QOQ: 0.0 SAAR: 0.1 | 1.9 |
Japan | QOQ: -0.4 SAAR: -1.5 | 0.9 |
China | 1.6 AE 6.6 | 6.9 |
Euro Area | 0.4 | 2.0 |
Germany | 0.4 | 2.1 |
France | 0.1 | 0.9 |
Italy | 0.5 | 1.3 |
UK | 0.7 | 2.4 |
IQ2016/IVQ2015 | IQ2016/IQ2015 | |
USA | QOQ: 0.5 SAAR: 2.0 | 1.6 |
Japan | QOQ: 0.5 SAAR: 2.0 | 0.2 |
China | 1.5 AE 6.1 | 6.9 |
Euro Area | 0.6 | 1.9 |
Germany | 0.8 | 2.0 |
France | 0.7 | 1.1 |
Italy | 0.3 | 1.5 |
UK | 0.2 | 2.1 |
IIQ2016/IQ2016 | IIQ2016/IIQ2015 | |
USA | QOQ: 0.5 SAAR: 1.9 | 1.3 |
Japan | QOQ: 0.1 SAAR: 0.6 | 0.2 |
China | 1.8 AE 7.4 | 6.8 |
Euro Area | 0.3 | 1.8 |
Germany | 0.6 | 3.7 |
France | -0.2 | 0.9 |
Italy | 0.2 | 1.2 |
UK | 0.5 | 1.9 |
IIIQ2016/IIQ2016 | IIIQ2016/IIIQ2015 | |
USA | QOQ: 0.5 SAAR: 2.2 | 1.6 |
Japan | QOQ: 0.2 SAAR: 0.9 | 0.5 |
China | 1.7 AE 7.0 | 6.8 |
Euro Area | 0.4 | 1.8 |
Germany | 0.2 | 1.9 |
France | 0.2 | 0.8 |
Italy | 0.5 | 1.6 |
UK | 0.5 | 1.9 |
IVQ2016/IIIQ2016 | IVQ2016/IVQ2015 | |
USA | QOQ: 0.5 SAAR: 2.0 | 2.0 |
Japan | QOQ: 0.3 SAAR: 1.2 | 1.2 |
China | 1.6 AE 6.6 | 6.9 |
Euro Area | 0.8 | 2.1 |
Germany | 0.4 | 1.4 |
France | 0.6 | 1.3 |
Italy | 0.3 | 1.4 |
UK | 0.6 | 1.8 |
IQ2017/IVQ2016 | IQ2017/IQ2016 | |
USA | QOQ: 0.6 SAAR: 2.3 | 2.1 |
Japan | QOQ: 1.2 SAAR: 4.7 | 1.8 |
China | 1.7 AE 7.0 | 7.0 |
Euro Area | 0.7 | 2.2 |
Germany | 1.2 | 3.6 |
France | 0.8 | 1.4 |
Italy | 0.6 | 1.6 |
UK | 0.6 | 2.2 |
IIQ2017/IQ2017 | IIQ2017/IIQ2016 | |
USA | QOQ: 0.5 SAAR: 2.2 | 2.2 |
Japan | QOQ: 0.4 SAAR: 1.4 | 1.9 |
China | 1.8 AE 7.4 | 7.0 |
Euro Area | 0.7 | 2.6 |
Germany | 0.6 | 1.0 CA 2.3 |
France | 0.7 | 2.4 |
Italy | 0.4 | 1.8 |
UK | 0.3 | 1.9 |
IIIQ2017/IIQ2017 | IIIQ2017/IIIQ2016 | |
USA | QOQ: 0.8 SAAR: 3.2 | 2.4 |
Japan | QOQ: 0.6 SAAR: 2.2 | 2.4 |
China | 1.6 AE 6.6 | 6.9 |
Euro Area | 0.8 | 2.9 |
Germany | 0.9 | 2.5 CA 3.0 |
France | 0.7 | 2.8 |
Italy | 0.4 | 1.6 |
UK | 0.3 | 1.8 |
IVQ2017/IIIQ2017 | IVQ2017/IVQ2016 | |
USA | QOQ: 0.9 SAAR: 3.5 | 2.8 |
Japan | QOQ: 0.5 SAAR: 1.9 | 2.5 |
China | 1.5 AE 6.1 | 6.8 |
Euro Area | 0.8 | 3.0 |
Germany | 0.7 | 2.8 CA 3.4 |
France | 0.8 | 3.1 |
Italy | 0.5 | 1.9 |
UK | 0.4 | 1.6 |
IQ2018/IVQ2017 | IQ2018/IQ2017 | |
USA | QOQ: 0.6 SAAR: 2.5 | 2.9 |
Japan | QOQ: -0.5 SAAR: -1.9 | 0.9 |
China | 1.7 AE 7.0 | 6.9 |
Euro Area | 0.2 | 2.6 |
Germany | 0.1 | 1.6 CA 2.3 |
France | 0.2 | 2.4 |
Italy | 0.0 | 1.3 |
UK | 0.1 | 1.1 |
IIQ2018/IQ2018 | IIQ2018/IIQ2017 | |
USA | QOQ: 0.9 SAAR: 3.5 | 3.2 |
Japan | QOQ: 0.4 SAAR: 1.8 | 1.0 |
China | 1.7 AE 7.0 | 6.9 |
Euro Area | 0.4 | 2.2 |
Germany | 0.4 | 2.5 CA 2.1 |
France | 0.2 | 1.9 |
Italy | 0.0 | 0.9 |
UK | 0.5 | 1.3 |
IIIQ2018/IIQ2018 | IIIQ2018/IIIQ2017 | |
USA | QOQ: 0.7 SAAR: 2.9 | 3.1 |
Japan | QOQ -0.8 SAAR: -3.3 | -0.3 |
China | 1.5 AE 6.1 | 6.7 |
Euro Area | 0.2 | 1.6 |
Germany | -0.1 | 1.1 CA 1.1 |
France | 0.3 | 1.6 |
Italy | -0.1 | 0.4 |
UK | 0.6 | 1.6 |
IVQ2018/IIIQ2018 | IVQ2018/IVQ2017 | |
USA | QOQ: 0.3 SAAR: 1.1 | 2.5 |
Japan | QOQ: 0.6 SAAR: 2.3 | -0.4 |
China | 1.5 AE 6.1 | 6.5 |
Euro Area | 0.4 | 1.2 |
Germany | 0.2 | 0.9 CA 0.6 |
France | 0.6 | 1.3 |
Italy | 0.2 | 0.1 |
UK | 0.2 | 1.4 |
IQ2019/IV2018 | IQ2019/IQ2018 | |
USA | QOQ: 0.8 SAAR: 3.1 | 2.7 |
Japan | QOQ: 0.6 SAAR: 2.6 | 0.8 |
China | 1.6 AE 6.6 | 6.4 |
Euro Area | 0.5 | 1.5 |
Germany | 0.5 | 0.9 CA 1.0 |
France | 0.5 | 1.7 |
Italy | 0.2 | 0.3 |
UK | 0.7 | 2.0 |
IIQ2019/IQ2019 | IIQ2019/IIQ2018 | |
USA | QOQ: 0.5 SAAR: 2.0 | 2.3 |
Japan | QOQ: 0.5 SAAR: 2.1 | 0.9 |
China | 1.5 AE 6.1 | 6.2 |
Euro Area | 0.1 | 1.2 |
Germany | -0.2 | -0.1 CA 0.3 |
France | 0.3 | 1.8 |
Italy | 0.1 | 0.4 |
UK | -0.2 | 1.3 |
IIIQ2019/IIQ2019 | IIIQ2019/IIIQ2018 | |
USA | QOQ: 0.5 SAAR 2.1 | 2.1 |
Japan | QOQ: 0.0 SAAR: 0.0 | 1.7 |
China | 1.3 AE 5.3 | 6.0 |
Euro Area | 0.3 | 1.3 |
Germany | 0.3 | 1.2 CA 0.7 |
France | 0.2 | 1.6 |
Italy | 0.0 | 0.5 |
UK | 0.5 | 1.3 |
IVQ2019/IIIQ2019 | IVQ2019/IVQ2018 | |
USA | QOQ: 0.5 SAAR: 2.1 | 2.3 |
Japan | QOQ: -1.9 SAAR: -7.2 | -0.7 |
China | 1.5 AE 6.1 | 6.0 |
Euro Area | 0.1 | 1.0 |
Germany | -0.1 | 0.2 CA 0.4 |
France | -0.1 | 0.9 |
Italy | -0.2 | 0.1 |
UK | 0.0 | 1.1 |
IQ2020/IVQ2019 | IQ2020/IQ2019 | |
USA | QOQ: -1.3 SAAR: -5.0 | 0.2 |
Japan | QOQ: -0.6 SAAR: -2.2 | -1.7 |
China | -9.8 (-71.0) | -6.8 |
Euro Area | -3.6 | -3.1 |
Germany | -2.2 | -1.9 CA -2.3 |
France | -5.3 | -5.0 |
Italy | -5.3 | -5.4 |
UK | -2.0 | -1.6 |
QOQ: Quarter relative to prior quarter; SAAR: seasonally adjusted annual rate
Source: Country Statistical Agencies http://www.bls.gov/bls/other.htm https://www.census.gov/programs-surveys/international-programs/about/related-sites.html
Table V-4 provides two types of data: growth of exports and imports in the latest available months and in the past 12 months; and contributions of net trade (exports less imports) to growth of real GDP.
- Japan. Japan provides the most worrisome data (http://cmpassocregulationblog.blogspot.com/2015/08/global-decline-of-values-of-financial.html and earlier http://cmpassocregulationblog.blogspot.com/2015/07/valuation-of-risk-financial-assets.html and earlier http://cmpassocregulationblog.blogspot.com/2015/06/fluctuating-financial-asset-valuations.html and earlier http://cmpassocregulationblog.blogspot.com/2015/06/dollar-revaluation-squeezing-corporate.html and earlier http://cmpassocregulationblog.blogspot.com/2015/04/imf-view-of-economy-and-finance-united.html and earlier http://cmpassocregulationblog.blogspot.com/2015/03/impatience-with-monetary-policy-of.html and earlier http://cmpassocregulationblog.blogspot.com/2015/02/world-financial-turbulence-squeeze-of.html and earlier (http://cmpassocregulationblog.blogspot.com/2015/02/financial-and-international.html and earlier http://cmpassocregulationblog.blogspot.com/2014/12/patience-on-interest-rate-increases.html and earlier (http://cmpassocregulationblog.blogspot.com/2014/11/squeeze-of-economic-activity-by-carry.html and earlier http://cmpassocregulationblog.blogspot.com/2014/09/world-inflation-waves-squeeze-of.html and earlier http://cmpassocregulationblog.blogspot.com/2014/08/monetary-policy-world-inflation-waves.html and earlier http://cmpassocregulationblog.blogspot.com/2014/07/world-inflation-waves-united-states.html and earlier (http://cmpassocregulationblog.blogspot.com/2014/06/valuation-risks-world-inflation-waves.html and earlier http://cmpassocregulationblog.blogspot.com/2014/05/united-states-commercial-banks-assets.html and earlier http://cmpassocregulationblog.blogspot.com/2014/05/financial-volatility-mediocre-cyclical.html and earlier http://cmpassocregulationblog.blogspot.com/2014/03/interest-rate-risks-world-inflation.html and earlier http://cmpassocregulationblog.blogspot.com/2014/03/financial-risks-slow-cyclical-united.html and earlier http://cmpassocregulationblog.blogspot.com/2014/02/mediocre-cyclical-united-states.html and earlier http://cmpassocregulationblog.blogspot.com/2013/12/tapering-quantitative-easing-mediocre.html and earlier http://cmpassocregulationblog.blogspot.com/2013/11/risks-of-zero-interest-rates-world.html http://cmpassocregulationblog.blogspot.com/2013/11/global-financial-risk-world-inflation.html http://cmpassocregulationblog.blogspot.com/2013/09/duration-dumping-and-peaking-valuations_8763.html http://cmpass ocregulationblog.blogspot.com/2013/08/interest-rate-risks-duration-dumping.html and earlier http://cmpassocregulationblog.blogspot.com/2013/07/duration-dumping-steepening-yield-curve.html and earlier http://cmpassocregulationblog.blogspot.com/2013/06/paring-quantitative-easing-policy-and_4699.html and earlier at http://cmpassocregulationblog.blogspot.com/2013/05/united-states-commercial-banks-assets.html and earlier http://cmpassocregulationblog.blogspot.com/2013/04/world-inflation-waves-squeeze-of.html and earlier http://cmpassocregulationblog.blogspot.com/2013/03/united-states-commercial-banks-assets.html and earlier at http://cmpassocregulationblog.blogspot.com/2013/02/world-inflation-waves-united-states.html and earlier at http://cmpassocregulationblog.blogspot.com/2013/02/thirty-one-million-unemployed-or.html and earlier http://cmpassocregulationblog.blogspot.com/2012/12/mediocre-and-decelerating-united-states_24.html and earlier http://cmpassocregulationblog.blogspot.com/2012/11/contraction-of-united-states-real_25.html and for GDP http://cmpassocregulationblog.blogspot.com/2015/09/interest-rate-policy-dependent-on-what_13.html). In May 2020, Japan’s exports decreased 28.3 percent in 12 months while imports decreased 26.2 percent. The second part of Table V-4 shows that net trade added 0.8 percent in IQ2012, deducting 2.0 percent in IIQ2012. Net trade deducted 1.9 percent in IIIQ2012. Net traded deducted 0.4 percent in IVQ2012. Net trade added 1.5 percentage points to GDP growth in IQ2013 but deducted 0.1 percentage points in IIQ2013, deducting 1.3 percentage points in IIIQ2013 and 2.2 percentage points in IVQ2013. Net trade deducted 0.7 percentage points from GDP growth in IQ2014. Net trade added 4.0 percentage points to GDP growth in IIQ2014 and deducted 0.3 percentage points in IIIQ2014. Net trade added 1.5 percentage points to GDP growth in IVQ2014. Net trade contributed 0.2 percentage points to GDP growth in IQ2015 and deducted 0.5-percentage points in IIQ2015. Net trade deducted 0.6 percentage points from GDP growth in IIIQ2015. Net trade contributed 0.1 percentage points to GDP growth in IVQ2015 and added 1.4 percentage points in IQ2016. Net trade contributed 0.5 percentage points to GDP growth in IIQ2016. Net trade added 1.2 percentage points to GDP growth in IIIQ2016 and contributed 1.5 percentage points in IVQ2016. Net trade contributed 0.4 percentage points to GDP growth in IQ2017 and deducted 0.9 percentage points in IIQ2017. Net trade contributed 2.1 percentage points to GDP growth in IIIQ2017 and deducted 0.3 percentage-point in IVQ2017. Net trade contributed 0.3 percentage points to GDP growth in IQ2018 and contributed 0.0 percentage points in IIQ2018. Net trade deducted 0.7 percentage points from GDP growth in IIIQ2018 and deducted 2.0 percentage points in IVQ2018. Net trade contributed 2.1 percentage points to GDP growth in IQ2019 with export contraction deducting 1.3 percent and import contraction contributing 3.4 percent. Net trade deducted 1.2 percentage points from GDP growth in IIQ2019. Net trade deducted 1.0 percentage points from GDP growth in IIIQ2019. Net trade contributed 2.1 percentage points to GDP growth in IVQ2019. Net trade deducted 0.8 percentage points from GDP growth in IQ2020 with export contraction deducting 4.2 percentage points and import contraction adding 3.4 percentage points.
- China. The exports of China decreased 3.3 percent in May 2020 relative to a year earlier while imports decreased 16.7 percent.
- Germany. Germany’s exports decreased 24.0 percent in the month of Apr 2020 and decreased 31.1 percent in the 12 months ending in Apr 2020. Germany’s imports decreased 16.5 percent in the month of Apr 2020 and decreased 21.6 percent in the 12 months ending in Apr 2020. Net trade contributed 0.8 percentage points to growth of GDP in IQ2012, contributed 0.3 percentage points in IIQ2012, contributed 0.4 percentage points in IIIQ2012, deducted 0.5 percentage points in IVQ2012, deducted 0.3 percentage points in IQ2013 and deducted 0.3 percentage points in IIQ2013. Net traded deducted 0.0 percentage points from Germany’s GDP growth in IIIQ2013 and added 0.9 percentage points to GDP growth in IVQ2013. Net trade deducted 0.1 percentage points from GDP growth in IQ2014. Net trade deducted 0.3 percentage points from GDP growth in IIQ2014 and added 0.7 percentage points in IIIQ2014. Net trade added 0.1 percentage points to GDP growth in IVQ2014 and deducted 0.4 percentage points in IQ2015. Net trade added 0.6 percentage points to GDP growth in IIQ2015 and deducted 0.4 percentage points in IIIQ2015. Net trade deducted 0.6 percentage points in IVQ2015 and deducted 0.4 percentage points in IQ2016. Net trade added 0.7 percentage points to GDP growth in IIQ2016. Net trade deducted 0.2 percentage points from GDP growth in IIIQ2016. Net trade deducted 0.7 percentage points in IVQ2016. Net trade added 0.7 percentage points to GDP growth in IQ2017. Net trade deducted 0.2 percentage points from GDP growth in IIQ2017. Net trade added 0.5 percentage points to GDP growth in IIIQ2017. Net trade added 0.1 percentage points to GDP growth in IVQ2017. Net trade contributed 0.1 percentage points to GDP growth in IQ2018 and deducted 0.2 percentage points from GDP growth in IIQ2018. Net trade deducted 1.0 percentage points from GDP growth in IIIQ2018. Net trade deducted 0.2 percentage points from GDP growth in IVQ2018. Net trade contributed 0.2 percentage points to GDP growth in IQ2019. Net trade deducted 0.5 percentage points from GDP growth in IIQ2019. Net traded added 0.8 percentage points to GDP growth in IIIQ2019. Net trade deducted 0.4 percentage points from GDP growth in IVQ2019. Net trade deducted 0.8 percentage points from GDP growth in IQ2020.
- United Kingdom. Net trade contributed 0.7 percentage points in IIQ2013. In IIIQ2013, net trade deducted 1.7 percentage points from UK growth. Net trade contributed 0.1 percentage points to UK value added in IVQ2013. Net trade contributed 0.8 percentage points to UK value added in IQ2014 and 0.3 percentage points in IIQ2014. Net trade deducted 0.7 percentage points from GDP growth in IIIQ2014 and added 0.0 percentage points in IVQ2014. Net traded deducted 0.4 percentage points from growth in IQ2015. Net trade added 1.1 percentage points to GDP growth in IIQ2015 and deducted 0.4 percentage points in IIIQ2015. Net trade deducted 0.2 percentage points from GDP growth in IVQ2015. Net trade deducted 0.1-percentage points from GDP growth in IQ2016. Net trade added 0.1 percentage points to GDP growth in IIQ2016. Net trade deducted 1.8 percentage points from GDP growth in IIIQ2016. Net trade added 1.7 percentage points to GDP growth in IVQ2016. Net trade added 0.33 percentage points to GDP growth in IQ2017 and contributed 0.01 percentage points in IIQ2017. Net trade contributed 0.11 percentage points to GDP growth in IIIQ2017. Net trade deducted 0.14 percentage points from GDP growth in IVQ2017. Net trade added 0.02 percentage points to GDP growth in IQ2018. Net trade deducted 0.26 percentage points from GDP growth in IIQ2018. Net trade contributed 0.44 percentage points to GDP growth in IIIQ2018. Net trade deducted 1.00 percentage points from GDP growth in IVQ2018. Net trade deducted 2.49 percentage points from GDP growth in IQ2019. Net trade contributed 2.71 percentage points to GDP growth in IIQ2019. Net trade contributed 1.36 percentage points to GDP growth in IIIQ2019. Net trade contributed 1.48 percentage points to GDP growth in IVQ2019. Net trade deducted 1.91 percentage points from GDP growth in IQ2020.
- France. France’s exports decreased 16.7 percent in Mar 2020 while imports decreased 18.5 percent. France’s exports decreased 18.4 percent in the 12 months ending in Mar 2020 and imports decreased 21.2 percent relative to a year earlier. Net traded added 0.1 percentage points to France’s GDP in IIIQ2012 and 0.1 percentage points in IVQ2012. Net trade deducted 0.1 percentage points from France’s GDP growth in IQ2013 and added 0.3 percentage points in IIQ2013, deducting 1.7 percentage points in IIIQ2013. Net trade added 0.1 percentage points to France’s GDP in IVQ2013 and deducted 0.1 percentage points in IQ2014. Net trade deducted 0.2 percentage points from France’s GDP growth in IIQ2014 and deducted 0.2 percentage points in IIIQ2014. Net trade added 0.2 percentage points to France’s GDP growth in IVQ2014 and deducted 0.2 percentage points in IQ2015. Net trade added 0.4 percentage points to GDP growth in IIQ2015 and deducted 0.6 percentage points in IIIQ2015. Net trade deducted 0.7 percentage points from GDP growth in IVQ2015 and deducted 0.1 percentage points from GDP growth in IQ2016. Net trade added 0.3 percentage points to GDP in IIQ2016. Net trade deducted 0.6 percentage points from GDP in IIIQ2016 and added 0.1 percentage points in IVQ2016. Net trade deducted 0.6 percentage points from GDP in IQ2017 and added 0.9 percentage points in IIQ2017. Net trade deducted 0.3 percentage points from GDP growth in IIIQ2017. Net trade added 0.6 percentage points to GDP growth in IVQ2017. Net trade added 0.0 percentage points to GDP growth in IQ2018. Net trade contributed 0.0 percentage points from GDP growth in IIQ2018. Net trade added 0.3 percentage points to GDP growth in IIIQ2018. Net trade added 0.2 percentage points to GDP in IVQ2018. Net trade deducted 0.3 percentage points from GDP in IQ2019. Net trade deducted 0.1 percentage points from GDP growth in IIQ219. Net trade deducted 0.3 percentage points from GDP growth in IIIQ2019. Net trade added 0.1 percentage points to GDP growth in IVQ2019. Net trade contributed 0.0 percentage points in IQ2020.
- United States. US exports decreased 20.5 percent in Apr 2020 and goods exports decreased 9.5 percent in Jan-Apr 2020 relative to a year earlier. Imports decreased 13.7 percent in Apr 2020 and goods imports decreased 9.0 percent in Jan-Apr 2020 relative to a year earlier. Net trade added 0.27 percentage points to GDP growth in IIQ2012 and deducted 0.08 percentage points in IIIQ2012, adding 0.57 percentage points in IVQ2012. Net trade added 0.40 percentage points to US GDP growth in IQ2013 and deducted 0.33 percentage points in IIQ2013. Net traded subtracted 0.14 percentage points from US GDP growth in IIIQ2013. Net trade added 1.23 percentage points to US GDP growth in IVQ2013. Net trade deducted 1.11 percentage points from US GDP growth in IQ2014 and deducted 0.46 percentage points in IIQ2014. Net trade added 0.10 percentage points to GDP growth in IIIQ2014. Net trade deducted 1.05 percentage points from GDP growth in IVQ2014 and deducted 1.67 percentage points from GDP growth in IQ2015. Net trade added 0.06 percentage points to GDP growth in IIQ2015. Net trade deducted 1.00 percentage points from GDP growth in IIIQ2015. Net trade deducted 0.20 percentage points from GDP growth in IVQ2015. Net trade deducted 0.50 percentage points from GDP growth in IQ2016. Net trade added 0.35 percentage points to GDP growth in IIQ2016. Net trade added 0.05 percentage points to GDP growth in IIIQ2016. Net trade deducted 1.36 percentage points from GDP growth in IVQ2016. Net trade added 0.13 percentage points to GDP growth in IQ2017. Net trade deducted 0.31 percentage points from GDP growth in IIQ2017. Net trade added 0.35 percentage points to GDP growth in IIIQ2017. Net trade deducted 0.80 percentage points from GDP growth in IVQ2017. Net trade deducted 0.00 percentage points from GDP growth in IQ2018. Net trade added 0.67 percentage points to GDP growth in IIQ2018. Net trade deducted 2.05 percentage points from GDP growth in IIIQ2018, deducting 0.35 percentage points in IVQ2018. Net trade added 0.73 percentage points in IQ2019, deducting 0.68 percentage points in IIQ2019. Net trade deducted 0.14 percentage points in IIIQ2019. Net trade added 1.51 percentage points in IVQ2019, adding 1.32 percentage points in IQ2020.
Industrial production increased 1.4 percent in May 2020 and decreased 12.5 percent in Apr 2020 after decreasing 4.6 percent in Mar 2020, with all data seasonally adjusted. The Board of Governors of the Federal Reserve System conducted the annual revision of industrial production released on Mar 27, 2019 (https://www.federalreserve.gov/releases/g17/revisions/Current/DefaultRev.htm):
“The Federal Reserve has revised its index of industrial production (IP) and the related measures of capacity and capacity utilization.[1] On net, the revisions to the growth rates for total IP for recent years were small and positive, with the estimates for 2016 and 2017 a bit higher and the estimates for 2015 and 2018 slightly lower.[2] Total IP is still reported to have increased from the end of the recession in mid-2009 through late 2014 before declining in 2015 and rebounding in mid-2016. Subsequently, the index advanced around 7 1/2 percent over 2017 and 2018.
Capacity for total industry expanded modestly in each year from 2015 to 2017 before advancing 1 1/2 percent in 2018; it is expected to advance about 2 percent in 2019. Revisions for recent years were very small and showed slightly less expansion in most years relative to earlier reports.
In the fourth quarter of 2018, capacity utilization for total industry stood at 79.4 percent, about 3/4 percentage point above its previous estimate and about 1/2 percentage point below its long-run (1972–2018) average. The utilization rate in 2017 is also higher than its previous estimate.”
The report of the Board of Governors of the Federal Reserve System states (https://www.federalreserve.gov/releases/g17/current/default.htm):
“Total industrial production increased 1.4 percent in May, as many factories resumed at least partial operations following suspensions related to COVID-19. Even so, total industrial production in May was 15.4 percent below its pre-pandemic level in February. Manufacturing output—which fell sharply in March and April—rose 3.8 percent in May; most major industries posted increases, with the largest gain registered by motor vehicles and parts. The indexes for mining and utilities declined 6.8 percent and 2.3 percent, respectively. At 92.6 percent of its 2012 average, the level of total industrial production was 15.3 percent lower in May than it was a year earlier. Capacity utilization for the industrial sector increased 0.8 percentage point to 64.8 percent in May, a rate that is 15.0 percentage points below its long-run (1972–2019) average and 1.9 percentage points below its trough during the Great Recession.” In the six months ending in May 2020, United States national industrial production accumulated change of minus 15.9 percent at the annual equivalent rate of minus 29.4 percent, which is lower than growth of minus 15.3 percent in the 12 months ending in May 2020. Excluding growth of 0.1 percent in Feb 2019, growth in the remaining five months from Dec 2019 to May 2020 accumulated to minus 16.0 percent or minus 34.3 percent annual equivalent. Industrial production increased 1.4 percent in one of the past six months, 0.1 percent in one month, minus 12.5 percent in one month, minus 4.6 percent in one month and minus 0.4 in two months. Industrial production decreased at annual equivalent 48.7 percent in the most recent quarter from Mar 2020 to May 2020 and decreased at 2.8 percent annual equivalent in the prior quarter from Dec 2019 to Feb 2020. Business equipment accumulated change of minus 27.6 percent in the six months from Dec 2019 to May 2020, at the annual equivalent rate of minus 47.7 percent, which is lower than growth of minus 27.1 percent in the 12 months ending in May 2020. The Fed analyzes capacity utilization of total industry in its report (https://www.federalreserve.gov/releases/g17/Current/default.htm): ” Capacity utilization for the industrial sector increased 0.8 percentage point to 64.8 percent in May, a rate that is 15.0 percentage points below its long-run (1972–2019) average and 1.9 percentage points below its trough during the Great Recession.” United States industry apparently decelerated to a lower growth rate followed by possible acceleration, weakening growth in past months and deep contraction in the global recession, with output in the US reaching a high in Feb 2020 (https://www.nber.org/cycles.html), in the lockdown of economic activity in the COVID-19 event.
Manufacturing decreased 22.3 percent from the peak in Jun 2007 to the trough in Apr 2009 and increased 18.3 percent from the trough in Apr 2009 to Dec 2019. Manufacturing increased 0.1 percent from the trough in Apr 2009 to May 2020. Manufacturing in May 2020 is lower by 22.2 percent relative to the peak in Jun 2007. The US maintained growth at 3.0 percent on average over entire cycles with expansions at higher rates compensating for contractions. US economic growth has been at only 2.1 percent on average in the cyclical expansion in the 43 quarters from IIIQ2009 to IQ2020 and in the global recession with output in the US reaching a high in Feb 2020 (https://www.nber.org/cycles.html), in the lockdown of economic activity in the COVID-19 event. Boskin (2010Sep) measures that the US economy grew at 6.2 percent in the first four quarters and 4.5 percent in the first 12 quarters after the trough in the second quarter of 1975; and at 7.7 percent in the first four quarters and 5.8 percent in the first 12 quarters after the trough in the first quarter of 1983 (Professor Michael J. Boskin, Summer of Discontent, Wall Street Journal, Sep 2, 2010 http://professional.wsj.com/article/SB10001424052748703882304575465462926649950.html). There are new calculations using the revision of US GDP and personal income data since 1929 by the Bureau of Economic Analysis (BEA) (http://bea.gov/iTable/index_nipa.cfm) and the second estimate of GDP for IQ2020 (https://www.bea.gov/sites/default/files/2020-05/gdp1q20_2nd.pdf). The average of 7.7 percent in the first four quarters of major cyclical expansions is in contrast with the rate of growth in the first four quarters of the expansion from IIIQ2009 to IIQ2010 of only 2.8 percent obtained by dividing GDP of $15,557.3 billion in IIQ2010 by GDP of $15,134.1 billion in IIQ2009 {[($15,557.3/$15,134.1) -1]100 = 2.8%], or accumulating the quarter on quarter growth rates (https://cmpassocregulationblog.blogspot.com/2020/05/mediocre-cyclical-united-states_31.html and earlier https://cmpassocregulationblog.blogspot.com/2020/05/mediocre-cyclical-united-states.html). The expansion from IQ1983 to IQ1986 was at the average annual growth rate of 5.7 percent, 5.3 percent from IQ1983 to IIIQ1986, 5.1 percent from IQ1983 to IVQ1986, 5.0 percent from IQ1983 to IQ1987, 5.0 percent from IQ1983 to IIQ1987, 4.9 percent from IQ1983 to IIIQ1987, 5.0 percent from IQ1983 to IVQ1987, 4.9 percent from IQ1983 to IIQ1988, 4.8 percent from IQ1983 to IIIQ1988, 4.8 percent from IQ1983 to IVQ1988, 4.8 percent from IQ1983 to IQ1989, 4.7 percent from IQ1983 to IIQ1989, 4.6 percent from IQ1983 to IIIQ1989, 4.5 percent from IQ1983 to IVQ1989. 4.5 percent from IQ1983 to IQ1990, 4.4 percent from IQ1983 to IIQ1990, 4.3 percent from IQ1983 to IIIQ1990, 4.0 percent from IQ1983 to IVQ1990, 3.8 percent from IQ1983 to IQ1991, 3.8 percent from IQ1983 to IIQ1991, 3.8 percent from IQ1983 to IIIQ1991, 3.7 percent from IQ1983 to IVQ1991, 3.7 percent from IQ1983 to IQ1992, 3.7 percent from IQ1983 to IIQ1992, 3.7 percent from IQ1983 to IIIQ2019, 3.8 percent from IQ1983 to IVQ1992, 3.7 percent from IQ1983 to IQ1993, 3.6 percent from IQ1983 to IIQ1993, 3.6 percent from IQ1983 to IIIQ1993 and at 7.9 percent from IQ1983 to IVQ1983 (https://cmpassocregulationblog.blogspot.com/2020/05/mediocre-cyclical-united-states_31.html and earlier https://cmpassocregulationblog.blogspot.com/2020/05/mediocre-cyclical-united-states.html). The National Bureau of Economic Research (NBER) dates a contraction of the US from IQ1990 (Jul) to IQ1991 (Mar) (https://www.nber.org/cycles.html). The expansion lasted until another contraction beginning in IQ2001 (Mar). US GDP contracted 1.3 percent from the pre-recession peak of $8983.9 billion of chained 2009 dollars in IIIQ1990 to the trough of $8865.6 billion in IQ1991 (https://apps.bea.gov/iTable/index_nipa.cfm). The US maintained growth at 3.0 percent on average over entire cycles with expansions at higher rates compensating for contractions. Growth at trend in the entire cycle from IVQ2007 to IQ2020 and in the global recession with output in the US reaching a high in Feb 2020 (https://www.nber.org/cycles.html), in the lockdown of economic activity in the COVID-19 event would have accumulated to 43.6 percent. GDP in IQ2020 would be $22,634.2 billion (in constant dollars of 2012) if the US had grown at trend, which is higher by $3659.5 billion than actual $18,974.7billion. There are more than three trillion dollars of GDP less than at trend, explaining the 47.4 million unemployed or underemployed equivalent to actual unemployment/underemployment of 27.5 percent of the effective labor force with the largest part originating in the global recession with output in the US reaching a high in Feb 2020 (https://www.nber.org/cycles.html), in the lockdown of economic activity in the COVID-19 event (https://cmpassocregulationblog.blogspot.com/2020/06/creation-of-three-million-private.html and earlier https://cmpassocregulationblog.blogspot.com/2020/05/fifty-two-million-unemployed-or.html). Unemployment is increasing sharply while employment is declining rapidly because of the lockdown of economic activity in the global recession resulting from the COVID-19 event (https://www.bls.gov/cps/employment-situation-covid19-faq-april-2020.pdf). US GDP in IQ2020 is 16.2 percent lower than at trend. US GDP grew from $15,762.0 billion in IVQ2007 in constant dollars to $18,974.7 billion in IQ2020 or 20.4 percent at the average annual equivalent rate of 1.5 percent. Professor John H. Cochrane (2014Jul2) estimates US GDP at more than 10 percent below trend. Cochrane (2016May02) measures GDP growth in the US at average 3.5 percent per year from 1950 to 2000 and only at 1.76 percent per year from 2000 to 2015 with only at 2.0 percent annual equivalent in the current expansion. Cochrane (2016May02) proposes drastic changes in regulation and legal obstacles to private economic activity. The US missed the opportunity to grow at higher rates during the expansion and it is difficult to catch up because growth rates in the final periods of expansions tend to decline. The US missed the opportunity for recovery of output and employment always afforded in the first four quarters of expansion from recessions. Zero interest rates and quantitative easing were not required or present in successful cyclical expansions and in secular economic growth at 3.0 percent per year and 2.0 percent per capita as measured by Lucas (2011May). There is cyclical uncommonly slow growth in the US instead of allegations of secular stagnation. There is similar behavior in manufacturing. There is classic research on analyzing deviations of output from trend (see for example Schumpeter 1939, Hicks 1950, Lucas 1975, Sargent and Sims 1977). The long-term trend is growth of manufacturing at average 2.9 percent per year from May 1919 to May 2020. Growth at 2.9 percent per year would raise the NSA index of manufacturing output (SIC, Standard Industrial Classification) from 108.2987 in Dec 2007 to 154.4475 in May 2020. The actual index NSA in May 2020 is 87.3585 which is 43.4 percent below trend. The underperformance of manufacturing in May 2020 originates partly in the earlier global recession augmented by the current global recession with output in the US reaching a high in Feb 2020 (https://www.nber.org/cycles.html), in the lockdown of economic activity in the COVID-19. Manufacturing grew at the average annual rate of 3.3 percent between Dec 1986 and Dec 2006. Growth at 3.3 percent per year would raise the NSA index of manufacturing output (SIC, Standard Industrial Classification) from 108.2987 in Dec 2007 to 162.0699 in May 2020. The actual index NSA in May 2020 is 87.3585, which is 46.1 percent below trend. Manufacturing output grew at average 1.4 percent between Dec 1986 and May 2020. Using trend growth of 1.4 percent per year, the index would increase to 128.7047 in May 2020. The output of manufacturing at 87.3585 in May 2020 is 32.1 percent below trend under this alternative calculation. Using the NAICS (North American Industry Classification System), manufacturing output fell from the high of 110.5147 in Jun 2007 to the low of 86.3800 in Apr 2009 or 21.8 percent. The NAICS manufacturing index increased from 86.3800 in Apr 2009 to 88.2710 in May 2020 or 2.2 percent. The NAICS manufacturing index increased at the annual equivalent rate of 3.5 percent from Dec 1986 to Dec 2006. Growth at 3.5 percent would increase the NAICS manufacturing output index from 106.6777 in Dec 2007 to 163.5246 in May 2020. The NAICS index at 88.2710 in May 2020 is 46.0 below trend. The NAICS manufacturing output index grew at 1.7 percent annual equivalent from Dec 1999 to Dec 2006. Growth at 1.7 percent would raise the NAICS manufacturing output index from 106.6777 in Dec 2007 to 131.5151 in May 2020. The NAICS index at 88.2710 in May 2020 is 32.9 percent below trend under this alternative calculation. Table I-13 provides national income by industry without capital consumption adjustment (WCCA). “Private industries” or economic activities have share of 86.8 percent in IIIQ2019. Most of US national income is in the form of services. In May 2020, there were 133.342 million nonfarm jobs NSA in the US, according to estimates of the establishment survey of the Bureau of Labor Statistics (BLS) (https://www.bls.gov/news.release/empsit.nr0.htm Table B-1). Total private jobs of 111.864 million NSA in May 2020 accounted for 83.9 percent of total nonfarm jobs of 133.342 million, of which 11.677 million, or 10.4 percent of total private jobs and 8.8 percent of total nonfarm jobs, were in manufacturing. Private service-providing jobs were 92.446 million NSA in May 2020, or 69.3 percent of total nonfarm jobs and 82.6 percent of total private-sector jobs. Manufacturing has share of 9.4 percent in US national income in IVQ2019 and durable goods 5.6 percent, as shown in Table I-13. Most income in the US originates in services. Subsidies and similar measures designed to increase manufacturing jobs will not increase economic growth and employment and may actually reduce growth by diverting resources away from currently employment-creating activities because of the drain of taxation.
Table V-4, Growth of Trade and Contributions of Net Trade to GDP Growth, ∆% and % Points
Exports | Exports 12 M ∆% | Imports | Imports 12 M ∆% | |
USA | -20.5 SA | -9.5 Jan-Apr NSA | -13.7 Apr NSA | -9.0 Jan-Apr SA |
Japan | May 2020 -28.3 Apr 2020 -21.9 Mar 2020 -11.7 Feb 2020 -1.0 Jan 2020 -2.6 Dec 2019 -6.3 Nov 2019 -7.9 Oct 2019 -9.2 Sep 2019 -5.2 Aug 2019 -8.2 Jul 2019 -1.6 Jun 2019 -6.7 May 2019 -7.8 Apr 2019 -2.4 Mar 2019 -2.4 Feb 2019 -1.2 Jan 2019 -8.4 Dec 2018 -3.8 Nov 2018 0.1 Oct 2018 8.2 Sep 2018 -1.2 Aug 2018 6.6 Jul 2018 3.9 Jun 2018 6.7 May 2018 8.1 Apr 2018 7.8 Mar 2018 2.1 Feb 2018 1.8 Jan 2018 12.2 Dec 2017 9.3 Nov 2017 16.2 Oct 2017 14.0 Sep 2017 14.1 Aug 2017 18.1 Jul 2017 13.4 Jun 2017 9.7 May 2017 14.9 Apr 2017 7.5 Mar 2017 12.0 Feb 2017 11.3 Jan 2017 1.3 Dec 2016 5.4 Nov 2016 -0.4 Oct 2016 -10.3 Sep 2016 -6.9 Aug 2016 9.6 Jul 2016 -14.0 Jun 2016 -7.8 May 2016 -11.3 Apr 2016 -10.1 Mar 2016 -6.8 Feb 2016 -4.0 Jan 2016 -12.9 Dec 2015 -8.0 Nov 2015 -3.3 Oct 2015 -2.1 Sep 2015 0.6 Aug 3.1 Jul 2015 7.6 Jun 2015 9.5 May 2015 2.4 Apr 8.0 Mar 8.5 Feb 2.4 Jan 17.0 Dec 12.9 Nov 4.9 Oct 9.6 Sep 6.9 Aug -1.3 Jul 3.9 Jun -2.0 May 2014 -2.7 Apr 2014 5.1 Mar 2014 1.8 Feb 2014 9.5 Jan 2014 9.5 Dec 2013 15.3 Nov 2013 18.4 Oct 2013 18.6 Sep 2013 11.5 Aug 2013 14.7 Jul 2013 12.2 Jun 2013 7.4 May 2013 10.1 Apr 2013 3.8 Mar 2013 1.1 Feb 2013 -2.9 Jan 2013 6.4 Dec -5.8 Nov -4.1 Oct -6.5 Sep -10.3 Aug -5.8 Jul -8.1 | May 2020 -26.2 Apr 2020 -7.2 Mar 2020 -5.0 Feb 2020 -14.0 Jan 2020 -3.6 Dec 2019 -4.9 Nov 2019 -15.7 Oct 2019 -14.8 Sep 2019 -1.5 Aug 2019 -12.0 Jul 2019 -1.2 Jun 2019 -5.2 May 2019 -1.5 Apr 2019 6.4 Mar 2019 1.1 Feb 2019 -6.7 Jan 2019 -0.6 Dec 2018 1.9 Nov 2018 12.5 Oct 2018 19.9 Sep 2018 7.0 Aug 2018 15.4 Jul 2018 14.6 Jun 2018 2.5 May 2018 14.0 Apr 2018 5.9 Mar 2018 -0.6 Feb 2018 16.6 Jan 2018 7.9 Dec 2017 14.9 Nov 2017 17.2 Oct 2017 18.9 Sep 2017 12.0 Aug 2017 15.2 Jul 2017 16.3 Jun 2017 15.5 May 2017 17.8 Apr 2017 15.1 Mar 2017 15.8 Feb 2017 1.2 Jan 2017 8.5 Dec 2016 -2.6 Nov 2016 -8.8 Oct 2016 -16.5 Sep 2016 -16.3 Aug 2016 -17.3 Jul 2016 -24.7 Jun 2016 -18.8 May 2016 -13.8 Apr 2016 -23.3 Mar 2016 -14.9 Feb 2016 -14.2 Jan 2016 -18.0 Dec 2015 -18.0 Nov 2015 -10.2 Oct 2015 -13.4 Sep 2015 -11.1 Aug -3.1 Jul 2015 -3.2 Jun 2015 -2.9 May 2015 -8.7 Apr -4.2 Mar -14.5 Feb -3.6 Jan -9.0 Dec 1.9 Nov -1.7 Oct 2.7 Sep 6.2 Aug -1.5 Jul 2.3 Jun 8.4 May 2014 -3.6 Apr 2013 3.4 Mar 2014 18.1 Feb 2014 9.0 Jan 2014 25.0 Dec 2013 24.7 Nov 2013 21.1 Oct 2013 26.1 Sep 2013 16.5 Aug 2013 16.0 Jul 2013 19.6 Jun 2013 11.8 May 2013 10.0 Apr 2013 9.4 Mar 2013 5.5 Feb 2013 7.3 Jan 2013 7.3 Dec 1.9 Nov 0.8 Oct -1.6 Sep 4.1 Aug -5.4 Jul 2.1 | ||
China | Jan-Dec 0.5 Jan-Dec 9.9 Jan-Dec 2017 7.9 Jan-Dec 2016 -7.7 Jan-Dec 2015 -2.8 | 2020 May -3.3 Apr 8.2 Mar -2.9 Jan-Feb -17.2 2019 Dec 7.6 Nov -1.1 Oct -0.9 Sep -3.2 Aug -1.0 Jul 3.3 Jun -1.3 May 1.1 Apr -2.7 Mar 14.2 Feb -20.7 Jan 9.3 2018 Dec -4.4 Nov 5.4 Oct 15.6 Sep 14.5 Aug 9.8 Jul 12.2 Jun 11.3 May 12.6 Apr 12.9 Mar -2.7 Feb 44.5 Jan 11.1 2017 Dec 10.9 Nov 12.3 Oct 6.9 Sep 8.1 Aug 5.5 Jul 7.2 Jun 11.3 May 8.7 Apr 8.0 Mar 16.4 Feb -1.3 Jan 7.9 2016 Dec 3.1 Nov 0.1 Oct -7.3 Sep -10.0 Aug -2.8 Jul -4.4 Jun -4.8 May -4.1 Apr -1.8 Mar 11.5 Feb -25.4 Jan -11.2 2015 -1.4 Dec -6.8 Nov -6.9 Oct -3.7 Sep -5.5 Aug -8.3 Jul 2.8 Jun -2.5 May -6.4 Apr -15.0 Mar 48.3 Feb -3.3 Jan 2014 9.7 Dec 4.7 Nov 11.6 Oct 15.3 Sep 9.4 Aug 14.5 Jul 7.2 Jun 7.0 May 0.9 Apr -6.6 Mar -18.1 Feb 10.6 Jan 2013 4.3 Dec 12.7 Nov 5.6 Oct -0.3 Sep 7.2 Aug 5.1 Jul -3.1 Jun 1.0 May 14.7 Apr 10.0 Mar 21.8 Feb 25.0 Jan | Jan-Dec -2.8 Jan-Dec 15.8 Jan-Dec 2017 15.9 Jan-Dec 2016 -5.5 Jan-Dec 2015 -14.1 | 2020 May -16.7 Apr -10.2 Mar -1.1 Jan-Feb -4.0 2019 Dec 16.3 Nov 0.3 Oct -6.4 Sep -8.5 Aug -5.6 Jul -5.3 Jun -7.3 May -8.5 Apr 4.0 Mar -7.6 Feb -5.2 Jan -1.5 2018 Dec -7.6 Nov 3.0 Oct 21.4 Sep 14.3 Aug 20.0 Jul 27.3 Jun 14.1 May 26.0 Apr 21.5 Mar 14.4 Feb 6.3 Jan 36.9 2017 Dec 4.5 Nov 17.7 Oct 17.2 Sep 18.7 Aug 13.3 Jul 11.0 Jun 17.2 May 14.8 Apr 11.9 Mar 20.3 Feb 38.1 Jan 16.7 2016 Dec -7.7 Nov 6.7 Oct -1.4 Sep -1.9 Aug 1.5 Jul -12.5 Jun -2.8 May -0.4 Apr -10.6 Mar -7.6 Feb -13.8 Jan -18.8 2015 -7.6 Dec -8.7 Nov -18.8 Oct -20.4 Sep -13.8 Aug -8.1 Jul -6.1 Jun -17.6 May -12.7 Mar -20.5 Feb -19.9 Jan 2014 -2.4 Dec -6.7 Nov 4.6 Oct 7.0 Sep -2.4 Aug -1.6 Jul 5.5 Jun -1.6 May -0.8 Apr -11.3 Mar 10.1 Feb 10.0 Jan 2013 8.3 Dec 5.3 Nov 7.6 Oct 7.4 Sep 7.0 Aug 10.9 Jul -0.7 Jun -0.3 May 16.8 Apr 14.1 Mar -15.2 Feb 28.8 Jan |
Euro Area | -28.2 12-M Apr 2020 | -8.3 Jan-Apr 2020 | -22.7 12-M Apr 2020 | -9.0 Jan- Apr 2020 |
Germany | -24.0 Apr CSA | -31.1 Apr | -16.5 Apr CSA | -21.6 Apr |
France Apr | -32.4 | -43.9 | -25.0 | -39.6 |
Italy Apr | -34.9 | -41.6 | -18.5 | -33.7 |
UK | 12.9 Mar | 4.2 | -3.5 Mar | -1.4 |
Net Trade % Points GDP Growth | Points | |||
USA | IQ2020 1.32 IVQ2019 1.51 IIIQ2019 -0.14 IIQ2019 -0.68 IQ2019 0.73 IVQ 2018 -0.35 IIIQ 2018 -2.05 IIQ2018 0.67 IQ2018 0.00 IVQ2017 -0.80 IIIQ2017 0.35 IIQ2017 -0.31 IQ2017 0.13 IVQ2016 -1.36 IIIQ2016 0.05 IIQ2016 0.35 IQ2016 -0.50 IVQ2015 -0.20 IIIQ2015 -1.00 IIQ2015 0.06 IQ2015 -1.67 IVQ2014 -1.05 IIIQ2014 0.10 IIQ2014 -0.46 IQ2014 -1.11 IVQ2013 1.23 IIIQ2013 -0.14 IIQ2013 -0.33 IQ2013 0.40 IVQ2012 +0.57 IIIQ2012 -0.08 IIQ2012 0.27 IQ2012 0.00 | |||
Japan | 0.8 IQ2012 -2.0 IIQ2012 -1.9 IIIQ2012 -0.4 IVQ2012 1.5 IQ2013 -0.1 IIQ2013 -1.3 IIIQ2013 -2.2 IVQ2013 -0.7 IQ2014 4.0 IIQ2014 -0.3 IIIQ2014 1.5 IVQ2014 0.2 IQ2015 -0.5 IIQ2015 -0.6 IIIQ2015 0.1 IVQ2015 1.4 IQ2016 0.5 IIQ2016 1.2 IIIQ2016 1.5 IVQ2016 0.4 IQ2017 -0.9 IIQ2017 2.1 IIIQ2017 -0.3 IVQ2017 0.3 IQ2018 0.0 IIQ2018 -0.7 IIIQ2018 -2.0 IVQ2018 2.1 IQ2019 -1.2 IIQ2019 -1.0 IIIQ2019 2.1 IVQ2019 -0.8 IQ2020 | |||
Germany | IQ2012 0.8 IIQ2012 0.3 IIIQ2012 0.4 IVQ2012 -0.5 IQ2013 -0.3 IIQ2013 -0.3 IIIQ2013 0.0 IVQ2013 0.9 IQ2014 -0.1 IIQ2014 -0.3 IIIQ2014 0.7 IVQ2014 0.1 IQ2015 -0.4 IIQ2015 0.6 IIIQ2015 -0.4 IVQ2015 -0.6 IQ2016 -0.4 IIQ2016 0.7 IIIQ2016 -0.2 IVQ2016 -0.7 IQ2017 0.7 IIQ2017 -0.2 IIIQ2017 0.5 IVQ2017 0.1 IQ2018 0.1 IIQ2018 -0.2 IIIQ2018 -1.0 IVQ2018 -0.2 IQ2019 0.2 IIQ2019 -0.5 IIIQ2019 0.8 IVQ2019 -0.4 IQ2020 -0.8 | |||
France | 0.1 IIIQ2012 0.1 IVQ2012 -0.1 IQ2013 0.3 IIQ2013 -1.7 IIIQ2013 0.1 IVQ2013 -0.1 IQ2014 -0.2 IIQ2014 -0.2 IIIQ2014 0.2 IVQ2014 -0.2 IQ2015 0.4 IIQ2015 -0.6 IIIQ2015 -0.7 IVQ2015 -0.1 IQ2016 0.3 IIQ2016 -0.6 IIIQ2016 0.1 IVQ2016 -0.6 IQ2017 0.9 IIQ2017 -0.3 IIIQ2017 0.6 IVQ2017 0.0 IQ2018 0.0 IIQ2018 0.3 IIIQ2018 0.2 IVQ2018 -0.3 IQ2019 -0.1 IIQ2019 -0.3 IIIQ2019 0.1 IVQ2019 0.0 IQ2020 | |||
UK | 0.7 IIQ2013 -1.7 IIIQ2013 0.1 IVQ2013 0.8 IQ2014 0.3 IIQ2014 -0.7 IIIQ2014 0.0 IVQ2014 -0.4 IQ2015 1.1 IIQ2015 -0.4 IIIQ2015 -0.2 IVQ2015 -0.1 IQ2016 0.1 IIQ2016 -1.8 IIIQ2016 1.7 IVQ2016 0.33 IQ2017 0.01 IIQ2017 | |||
0.11 | ||||
IIIQ2017 -0.14 IVQ2017 0.02 IQ2018 -0.26 IIQ2018 0.44 IIIQ2018 -1.00 IVQ2018 -2.49 IQ2019 2.71 IIQ2019 1.36 IIIQ2019 1.48 IVQ2019 -1.91 IQ2020 |
Sources: Country Statistical Agencies
https://www.bls.gov/bls/other.htm https://www.census.gov/programs-surveys/international-programs/about/related-sites.html
The geographical breakdown of exports and imports of Japan with selected regions and countries is in Table V-5 for May 2020. There are global economic effects in the global recession, with output in the US reaching a high in Feb 2020 (https://www.nber.org/cycles.html), in the lockdown of economic activity in the COVID-19 event. The share of Asia in Japan’s trade is close to one-half for 65.6 percent of exports and 54.6 percent of imports. Within Asia, exports to China are 26.9 percent of total exports and imports from China 30.1 percent of total imports. While exports of Japan to China decreased 1.9 percent in the 12 months ending in May 2020, imports from China decreased 2.0 percent. The second largest export market for Japan in May 2020 is the US with share of 14.1 percent of total exports, which is below that of China, and share of imports from the US of 11.5 percent in total imports. Japan’s exports to the US decreased 50.6 percent in the 12 months ending in May 2020 and imports from the US decreased 27.5 percent. Western Europe has share of 10.1 percent in Japan’s exports and of 13.1 percent in imports. Rates of growth of exports of Japan in May 2020 are minus 50.6 percent for exports to the US, minus 35.9 percent for exports to Brazil and minus 35.5 percent for exports to Germany. Comparisons relative to 2011 may have some bias because of the effects of the Tōhoku or Great East Earthquake and Tsunami of Mar 11, 2011. The global recession in the lockdown of economic activity in the COVID-19 event can reduce world trade and economic activity. Growth rates of imports in the 12 months ending in May 2020 are mixed. Imports from Asia decreased 11.8 percent in the 12 months ending in May 2020 while imports from China decreased 2.0 percent. Data are in millions of yen, which may have effects of recent depreciation of the yen relative to the United States dollar (USD) and revaluation of the dollar relative to the euro with multiple oscillations. There are also strong economic repercussions in the global recession, with output in the US reaching a high in Feb 2020 (https://www.nber.org/cycles.html), in the lockdown of economic activity in the COVID-19 event.
Table V-5, Japan, Value and 12-Month Percentage Changes of Exports and Imports by Regions and Countries, ∆% and Millions of Yen
May 2020 | Exports | 12 months ∆% | Imports Millions of Yen | 12 months ∆% |
Total | 4,184,784 | -28.3 | 5,018,172 | -26.2 |
Asia | 2,744,946 % Total 65.6 | -12.0 | 2,739,067 % Total 54.6 | -11.8 |
China | 1,126,222 % Total 26.9 | -1.9 | 1,511,296 % Total 30.1 | -2.0 |
USA | 588,415 % Total 14.1 | -50.6 | 578,159 % Total 11.5 | -27.5 |
Canada | 25,509 | -67.3 | 84,915 | -18.8 |
Brazil | 17,452 | -35.9 | 49,432 | -20.3 |
Mexico | 36,223 | -62.5 | 40,115 | -37.7 |
Western Europe | 422,497 % Total 10.1 | -35.4 | 659,410 % Total 13.1 | -30.9 |
Germany | 105,177 | -35.5 | 175,061 | -32.3 |
France | 43,644 | -20.5 | 74,795 | -48.8 |
UK | 60,525 | -38.2 | 47,236 | -42.7 |
Middle East | 83,632 | -48.6 | 226,451 | -72.0 |
Australia | 52,961 | -59.4 | 281,461 | -28.5 |
Source: Japan, Ministry of Finance https://www.customs.go.jp/toukei/info/index_e.htm
World trade projections of the IMF are in Table V-6. There is decreasing growth of the volume of world trade of goods and services from 3.6 percent in 2018 to 1.1 percent in 2019, stabilizing to 3.2 percent in 2020. Growth stabilizes at 3.3 percent on average from 2018 to 2024. World trade would be slower for advanced economies while emerging and developing economies (EMDE) experience faster growth. World economic slowdown would be more challenging with lower growth of world trade.
Table V-6, IMF, Projections of World Trade, USD Billions, USD/Barrel and Annual ∆%
2018 | 2019 | 2020 | Average ∆% 2018-2024 | |
World Trade Volume (Goods and Services) | 3.6 | 1.1 | 3.2 | 3.3 |
Exports Goods & Services | 3.4 | 1.3 | 3.1 | 3.5 |
Imports Goods & Services | 3.8 | 1.0 | 3.3 | 3.4 |
Exports Goods & Services | ||||
G7 | 2.6 | 0.7 | 2.2 | 2.5 |
EMDE | 3.9 | 1.9 | 4.1 | 4.1 |
Imports Goods & Services | ||||
G7 | 3.2 | 1.5 | 2.6 | 2.7 |
EMDE | 5.1 | 0.7 | 4.3 | 4.3 |
Terms of Trade Goods & Services | ||||
G7 | -0.7 | 0.6 | 0.3 | 0.0 |
EMDE | 1.5 | -1.3 | -1.1 | -0.2 |
World Crude Oil Price $/Barrel | 68.3 | 61.8 | 57.9 | 58.3 |
Crude Oil: Simple Average of three spot prices: Dated Brent, West Texas Intermediate and the Dubai Fateh
Source: International Monetary Fund World Economic Outlook databank
https://www.imf.org/external/pubs/ft/weo/2019/02/weodata/index.aspx
The JP Morgan Global Composite Output Index of the JP Morgan Manufacturing and Services PMI™, produced by JP Morgan and HIS Markit in association with ISM and IFPSM, with high association with world GDP, increased to 36.3 in May from 26.2 in Apr, indicating slower contraction from prior faster contraction (https://www.markiteconomics.com/Public/Home/PressRelease/608f70e0c72e4db48a23c345115e4e7a). This index had remained above the contraction territory of 50.0 during 88 consecutive months. The employment index increased from 39.2 in Apr to 41.3 in May with input prices decreasing at slower rate, new export orders decreasing and output decreasing (https://www.markiteconomics.com/Public/Home/PressRelease/608f70e0c72e4db48a23c345115e4e7a). The JP Morgan Global Manufacturing PMI™, produced by JP Morgan and IHS Markit in association with ISM and IFPSM, increased to 42.4 in May from 39.6 in Apr (https://www.markiteconomics.com/Public/Home/PressRelease/2d0ae6c49faf4739960eae3aa1d86668). New export orders decreased. The Markit Brazil Composite Output Index increased from 26.5 in Apr to 28.1 in May, indicating contraction in activity of Brazil’s private sector (https://www.markiteconomics.com/Public/Home/PressRelease/ed31e73b1e04443aae859a3dfae4f062). The Markit Brazil Services Business Activity index, compiled by Markit, increased from 27.4 in Apr to 27.6 in May indicating contracting services activity (https://www.markiteconomics.com/Public/Home/PressRelease/ed31e73b1e04443aae859a3dfae4f062). Paul Smith, Economics Director at HIS Markit, finds contracting activity (https://www.markiteconomics.com/Public/Home/PressRelease/ed31e73b1e04443aae859a3dfae4f062). The HIS Markit Brazil Manufacturing Purchasing Managers’ IndexTM (PMI™) decreased from 36.0 in Apr to 38.3 in May, indicating manufacturing below neutral 50.0 (https://www.markiteconomics.com/Public/Home/PressRelease/bd7778e5ed3e48b3a97261ba61b64b38). Paul Smith, Economics Director at HIS Markit, finds weaker manufacturing (https://www.markiteconomics.com/Public/Home/PressRelease/bd7778e5ed3e48b3a97261ba61b64b38).
VA United States. The HIS Markit Flash US Manufacturing Purchasing Managers’ Index™ (PMI™) seasonally adjusted increased to 39.8 in May from 36.1 in Apr (https://www.markiteconomics.com/Public/Home/PressRelease/3ea9e157cc5d447c9ecbb1ad5037cbf6). New export orders decreased. The HIS Markit Flash US Services PMI™ Business Activity Index increased from 26.7 in Apr to 36.9 in May (https://www.markiteconomics.com/Public/Home/PressRelease/3ea9e157cc5d447c9ecbb1ad5037cbf6). The IHS Markit Flash US Composite PMI™ Output Index increased from 27.0 in Apr to 36.4 in May (https://www.markiteconomics.com/Public/Home/PressRelease/3ea9e157cc5d447c9ecbb1ad5037cbf6). Chris Williamson, Chief Business Economist at IHS Markit, finds that the surveys are consistent with sharp contraction of GDP at close to 37 percent in IIQ2020 (https://www.markiteconomics.com/Public/Home/PressRelease/3ea9e157cc5d447c9ecbb1ad5037cbf6). The HIS Markit US Composite PMI™ Output Index of Manufacturing and Services increased to 37.0 in May from 27.0 in Apr (https://www.markiteconomics.com/Public/Home/PressRelease/bd9b8bac880144f1a56b2d8ab7669d14). The HIS Markit US Services PMI™ Business Activity Index increased from 26.7 in Apr to 37.5 in May (https://www.markiteconomics.com/Public/Home/PressRelease/bd9b8bac880144f1a56b2d8ab7669d14). Chris Williamson, Chief Business Economist at IHS Markit, finds the indexes suggesting sharp contraction with improving outlook (https://www.markiteconomics.com/Public/Home/PressRelease/bd9b8bac880144f1a56b2d8ab7669d14). The HIS Markit US Manufacturing Purchasing Managers’ Index™ (PMI™) increased to 39.8 in May from 36.1 in Apr (https://www.markiteconomics.com/Public/Home/PressRelease/42285f78fdc1438fb0b4031e132b5e77). New foreign orders decreased. Chris Williamson, Chief Business Economist at HIS Markit, finds easing contraction (https://www.markiteconomics.com/Public/Home/PressRelease/42285f78fdc1438fb0b4031e132b5e77). The purchasing managers’ index (PMI) of the Institute for Supply Management (ISM) Report on Business® increased 1.6-percentage points from 41.5 in Apr to 43.1 in May, which indicates contraction (https://www.instituteforsupplymanagement.org/ISMReport/MfgROB.cfm?SSO=1). The index of new export orders increased 4.2 percentage points from 35.3 in Apr to 39.5 in May. The Non-Manufacturing ISM Report on Business® PMI increased 3.6 percentage points from 41.8 in Apr to 45.4 in May, while the index of new orders increased 9.0 percentage points from 32.9 in Apr to 41.9 in May (https://www.instituteforsupplymanagement.org/ISMReport/NonMfgROB.cfm). Table USA provides the country economic indicators for the US.
Table USA, US Economic Indicators
Consumer Price Index | May 12 months NSA ∆%: 0.1; Ex food and energy ∆%: 1.2 May month SA ∆%: -0.1; Ex food and energy ∆%: -0.1 WIW 5/31/20 |
Producer Price Index | Finished Goods May 12-month NSA ∆%: -2.8; ex food and energy ∆% 1.1 Final Demand May 12-month NSA ∆%: -0.8; ex food and energy ∆% 0.3 May month SA ∆% 0.4; ex food and energy ∆%: -0.1 WIW 5/31/20 |
PCE Inflation | Apr 12-month NSA ∆%: headline 0.5 ex food and energy ∆% 1.0 |
Employment Situation | Household Survey: May Unemployment Rate SA 13.3% |
Nonfarm Hiring | Nonfarm Hiring increased from 64.9 million in 2006 to 69.9 million in 2019 or by 5.1 million while noninstitutional civilian population increased 30.6 million. Nonfarm hiring was 26.4 percent of population in 2006 but only 25.3 percent in 2019. |
GDP Growth | BEA Revised National Income Accounts IIQ2012/IIQ2011 2.4 IIIQ2012/IIIQ2011 2.5 IVQ2012/IVQ2011 1.5 IQ2013/IQ2012 1.6 IIQ2013/IIQ2012 1.3 IIIQ2013/IIIQ2012 1.9 IVQ2013/IVQ2012 2.6 IQ2014/IQ2013 1.4 IIQ2014/IIQ2013 2.7 IIIQ2014/IIIQ2013 3.1 IVQ2014/IVQ2013 2.9 IQ2015/IQ2014 4.0 IIQ2015/IIQ2014 3.4 IIIQ2015/IIIQ2014 2.4 IVQ2015/IVQ2014 1.9 IQ2016/IQ2015 1.6 IIQ2016/IIQ2015 1.3 IIIQ2016/IIIQ2015 1.6 IVQ2016/IVQ2015 2.0 IQ2017/IQ2016 2.1 IIQ2017/IIQ2016 2.2 IIIQ2017/IIIQ2016 2.4 IVQ2017/IVQ2016 2.8 IQ2018/IQ2017 2.9 IIQ2018/IIQ2017 3.2 IIIQ2018/IIIQ2017: 3.1 IVQ2018/IVQ2017 2.5 IQ2019/IQ2018 2.7 IIQ2019/IIQ2018 2.3 IIIQ2019/IIIQ2018 2.1 IVQ2019/IVQ2018 2.3 IQ2020/IQ2019 0.2 IQ2012 SAAR 3.2 IIQ2012 SAAR 1.7 IIIQ2012 SAAR 0.5 IVQ2012 SAAR 0.5 IQ2013 SAAR 3.6 IIQ2013 SAAR 0.5 IIIQ2013 SAAR 3.2 IVQ2013 SAAR 3.2 IQ2014 SAAR -1.1 IIQ2014 SAAR 5.5 IIIQ2014 SAAR 5.0 IVQ2014 SAAR 2.3 IQ2015 SAAR 3.2 IIQ2015 SAAR: 3.0 IIIQ2015 SAAR: 1.3 IVQ2015 SAAR: 0.1 IQ2016 SAAR: 2.0 IIQ2016 SAAR: 1.9 IIIQ2016 SAAR: 2.2 IVQ2016 SAAR 2.0 IQ2017 SAAR 2.3 IIQ2017 SAAR 2.2 IIIQ2017 SAAR 3.2 IVQ2017 SAAR 3.5 IQ2018 SAAR 2.5 IIQ2018 SAAR 3.5 IIIQ2018 SAAR 2.9 IVQ2018 SAAR 1.1 IQ2019 SAAR 3.1 IIQ2019 SAAR 2.0 IIIQ2019 SAAR 2.1 IVQ2019 SAAR 2.1 IQ2020 SAAR -5.0 |
Real Private Fixed Investment | SAAR IQ2020 ∆% -2.4 IVQ2007 to IQ2020: ∆% 25.7 Blog 5/31/20 |
Corporate Profits | IQ2020 SAAR: Corporate Profits -14.2; Undistributed Profits -52.3 Blog 5/31/20 |
Personal Income and Consumption | Apr month ∆% SA Real Disposable Personal Income (RDPI) SA ∆% 13.4 |
Quarterly Services Report | IQ20/IQ19 NSA ∆%: Financial & Insurance 2.5 Earlier Data: |
Employment Cost Index | Compensation Private IQ2020 SA ∆%: 0.8 Mar 12 months ∆%: 2.8 Earlier Data: |
Industrial Production | May month SA ∆%: 1.4 Manufacturing May ∆% SA 3.8 ∆% May 12 months SA ∆% minus 18.0 NSA minus 16.5 |
Productivity and Costs | Nonfarm Business Productivity IQ2020∆% SAAE -2.5; IQ2020/IQ2019 ∆% 0.3; Unit Labor Costs SAAE IQ2020 ∆% 4.8; IQ2020/IQ2019 ∆%: 1.5 Blog 5/17/20 |
New York Fed Manufacturing Index | General Business Conditions from May -48.5 to Jun -0.2 |
Philadelphia Fed Business Outlook Index | General Index from Apr -43.1 to Jun 27.5 |
Manufacturing Shipments and Orders | Apr Orders SA ∆% -13.0 Ex Transport -8.5 Jan-Apr 20/Jan-Apr 19 NSA New Orders ∆% -8.0 Ex transport -3.7 Earlier data: |
Durable Goods | Mar New Orders SA ∆%: minus 14.4 ex transport ∆%: -0.2 Earlier Data: |
Sales of New Motor Vehicles | IIQ2018 4,500,220; IIQ2017 4,419,349. Feb 20 Total Light Vehicles NSA 1356.3 thousand increasing 8.4% from 1251.5 thousand in Feb 2019. Feb 20 SAAR 16.8 million, Jan 20 SAAR 16.9 million, Feb 19 SAAR 16.5 million Total Vehicles Sales SAAR 17.049 Apr 2019, 11.742 SAAR Mar 2020, 8.841 SAAR Apr 2020 Blog 9/9/18 12/9/18 3/8/20 5/10/20 6/7/20 |
Sales of Merchant Wholesalers | Jan-Apr 2020/Jan-Apr 2019 NSA ∆%: Total -4.7; Durable Goods: minus 6.1; Nondurable EARLIER DATA: |
Sales and Inventories of Manufacturers, Retailers and Merchant Wholesalers | Apr 20 12-M NSA ∆%: Sales Total Business -18.4; Manufacturers -19.4 |
Sales for Retail and Food Services | May 2020/May 2019 ∆%: Retail and Food Services minus 4.7; Retail ∆% minus 2.2 |
Value of Construction Put in Place | SAAR month SA Apr ∆%: -2.9 Jan-Apr 20/Jan-Apr 19 NSA: 7.1 Earlier Data: |
Case-Shiller Home Prices | National Mar ∆% SA 0.5 National Mar 12M ∆% 4.4 |
FHFA House Price Index Purchases Only | Mar SA ∆% 0.1; |
New House Sales | Apr month SAAR ∆%: 0.6 |
Housing Starts and Permits | May Starts month SA ∆% 4.3; Permits ∆%: 14.4 Earlier Data: |
Rate of Homeownership | IQ2020 65.3 IVQ2019: 65.1 Blog 5/10/20 |
Trade Balance | Balance Apr SA -$49,408 million versus Mar -$42,340 million |
Export and Import Prices | May 12-month NSA ∆%: Imports -6.0; Exports -6.0 Earlier Data: |
International Terms of Trade | IQ2020 109.189 IVQ1947 150.474 2019 109.928 1929 142.590 Blog 5/31/20 |
Consumer Credit | Mar ∆% annual rate: Total minus 3.4; Revolving minus 30.9 Nonrevolving 6.2 Earlier Data: |
Net Foreign Purchases of Long-term Treasury Securities | Apr Net Foreign Purchases of Long-term US Securities: minus $155.1 billion |
Treasury Budget | Fiscal Year 2020/2019 ∆% May: Receipts minus 11.2; Outlays 29.4 Individual Income Taxes minus 23.1 Deficit Fiscal Year 2012 $1,077 billion Deficit Fiscal Year 2013 $680 billion Deficit Fiscal Year 2014 $485 billion Deficit Fiscal Year 2015 $442 billion Deficit Fiscal Year 2016 $585 billion Deficit Fiscal Year 2017 $665 billion Deficit Fiscal Year 2018 $779 billion Deficit Fiscal Year 2019 $984 billion Blog 6/21/20 |
CBO Budget and Economic Outlook | 2012 Deficit $1087 B 6.8% GDP Debt $11,281 B 70.4% GDP 2013 Deficit $680 B, 4.1% GDP Debt $11,983 B 72.6% GDP 2014 Deficit $485 B 2.8% GDP Debt $12,780 B 74.1% GDP 2015 Deficit $438 B 2.4% GDP Debt $13,117 B 72.9% GDP 2016 Deficit $585 3.2% GDP Debt $14,168.4 B 76.7% GDP 2017 Deficit $665 3.5% GDP Debt $14,665 76.5% GDP 2028 Deficit $1,526 B, 5.1 % GDP Debt $28,671 B 96.2% GDP 2048: Long-term Debt/GDP 152.0% Blog 8/26/12 11/18/12 2/10/13 9/22/13 2/16/14 8/24/14 9/14/14 3/1/15 6/21/15 1/3/16 4/10/16 7/24/16 1/8/17 4/2/17 10/14/18 |
Commercial Banks Assets and Liabilities | Sep 2019 SAAR ∆%: Securities 21.0 Loans 2.2 Cash Assets -36.6 Deposits 7.9 Blog 10/20/19 |
Flow of Funds Net Worth of Families and Nonprofits | IVQ2019 ∆ since 2007 Assets +$49,798.9 BN Nonfinancial +$8,792.5 BN Real estate +$7,163.9 BN Financial +$41,006.5 BN Net Worth +$47,725.9 BN Net Worth IVQ2018/IIIQ2018 ∆% -3.1 Corporate Equity ∆% -13.1 Blog 4/19/20 |
Current Account Balance of Payments and Net International Investment Position | Current Account IVQ2019 NSA minus $113,883 MM % GDP 2.0 SA Minus $10,991 B Blog 9/23/2018 2/10/2018 3/31/2019 7/7/2019 9/29/2019 11/3/2019 1/19/20 4/12/20 |
Collapse of United States Dynamism of Income Growth and Employment Creation | Blog 5/24/20 |
Squeeze of Economic Activity by Carry Trades | Blog 6/21/20 |
IMF View | World Real Economic Growth 2020 ∆% -3.1 Blog 11/3/19 5/3/20 |
Income, Poverty and Health Insurance in the United States | 43.123 Million Below Poverty in 2015, 13.5% of Population Median Family Income CPI-2015 Adjusted $56,516 in 2015 back to 1999 Levels Uncovered by Health Insurance 28.966 Million in 2015 Blog 9/25/16 |
Monetary Policy and Cyclical Valuation of Risk Financial Assets | Blog 1/7/2018 |
Rules versus Discretionary Authorities in Monetary Policy | Blog 1/1/2017 |
Links to blog comments in Table USA: 6/14/20 https://cmpassocregulationblog.blogspot.com/2020/06/global-recession-with-output-in-us.html
6/7/20 https://cmpassocregulationblog.blogspot.com/2020/06/creation-of-three-million-private.html
5/31/20 https://cmpassocregulationblog.blogspot.com/2020/05/mediocre-cyclical-united-states_31.html
5/24/2020 https://cmpassocregulationblog.blogspot.com/2020/05/recovery-without-hiring-twenty-million.html
5/17/20 https://cmpassocregulationblog.blogspot.com/2020/05/united-states-inflation-rules.html
5/10/20 https://cmpassocregulationblog.blogspot.com/2020/05/fifty-two-million-unemployed-or.html
5/3/20 https://cmpassocregulationblog.blogspot.com/2020/05/mediocre-cyclical-united-states.html
4/26/20 https://cmpassocregulationblog.blogspot.com/2020/04/valuations-of-risk-financial-assets.html
4/19/20 https://cmpassocregulationblog.blogspot.com/2020/04/contraction-of-united-states.html
4/12/20 https://cmpassocregulationblog.blogspot.com/2020/04/united-states-imbalances-of-internal.html
4/5/2020 https://cmpassocregulationblog.blogspot.com/2020/04/lockdown-of-economic-activity-in.html
3/29/2020 https://cmpassocregulationblog.blogspot.com/2020/03/weekly-rise-of-valuations-of-risk.html
3/22/20 https://cmpassocregulationblog.blogspot.com/2020/03/sharp-contraction-of-valuations-of-risk.html
3/15/20 https://cmpassocregulationblog.blogspot.com/2020/03/financial-markets-stress-in.html
3/8/20 https://cmpassocregulationblog.blogspot.com/2020/03/stress-of-world-financial-markets-fomc.html
3/1/20 https://cmpassocregulationblog.blogspot.com/2020/02/sharp-worldwide-contraction-of.html
2/23/20 https://cmpassocregulationblog.blogspot.com/2020/02/declining-valuations-of-risk-financial.html
2/16/20 https://cmpassocregulationblog.blogspot.com/2020/02/recovery-without-hiring-in-lost.html
2/9/2020 https://cmpassocregulationblog.blogspot.com/2020/02/increasing-valuations-of-risk-financial.html
2/2/2020 https://cmpassocregulationblog.blogspot.com/2020/02/decreasing-valuations-of-risk-financial.html
1/26/20 https://cmpassocregulationblog.blogspot.com/2020/01/declining-valuations-of-risk-financial.html
1/19/20 https://cmpassocregulationblog.blogspot.com/2020/01/rising-valuations-of-risk-financial.html
1/12/20 https://cmpassocregulationblog.blogspot.com/2020/01/increasing-valuations-of-risk-financial.html
1/5/20 https://cmpassocregulationblog.blogspot.com/2020/01/fluctuating-valuations-of-risk.html
12/29/19 https://cmpassocregulationblog.blogspot.com/2019/12/diverging-economic-conditions-and.html
12/22/19 https://cmpassocregulationblog.blogspot.com/2019/12/oscillating-valuations-of-risk.html
12/15/19 https://cmpassocregulationblog.blogspot.com/2019/12/increase-in-valuations-of-risk_14.html
12/8/19 https://cmpassocregulationblog.blogspot.com/2019/12/increase-in-valuations-of-risk.html
12/1/19 https://cmpassocregulationblog.blogspot.com/2019/11/fluctuating-valuations-of-risk.html
11/24/19 https://cmpassocregulationblog.blogspot.com/2019/11/oscillating-risk-financial-assets-world.html
11/17/19 https://cmpassocregulationblog.blogspot.com/2019/11/increasing-valuations-of-risk-financial_16.html
11/10/19 https://cmpassocregulationblog.blogspot.com/2019/11/increasing-valuations-of-risk-financial.html
11/3/19 https://cmpassocregulationblog.blogspot.com/2019/11/decrease-of-fomc-policy-rate-monetary.html
10/27/19 https://cmpassocregulationblog.blogspot.com/2019/10/increasing-valuations-of-risk-financial_26.html
10/20/19 https://cmpassocregulationblog.blogspot.com/2019/10/dollar-depreciation-fluctuating.html
10/13/19 https://cmpassocregulationblog.blogspot.com/2019/10/increasing-valuations-of-risk-financial.html
10/6/19 https://cmpassocregulationblog.blogspot.com/2019/10/volatility-of-valuations-of-risk.html
9/29/19 https://cmpassocregulationblog.blogspot.com/2019/09/dollar-appreciation-decreasing.html
9/22/19 https://cmpassocregulationblog.blogspot.com/2019/09/uncertain-fomc-outlook-of-monetary.html
9/15/19 https://cmpassocregulationblog.blogspot.com/2019/09/competitive-exchange-rate-and-interest.html
9/8/19 https://cmpassocregulationblog.blogspot.com/2019/09/increase-in-valuations-of-risk.html
9/1/19 https://cmpassocregulationblog.blogspot.com/2019/08/revaluation-of-us-dollar-falling-yields.html
8/25/19 https://cmpassocregulationblog.blogspot.com/2019/08/contraction-of-valuations-of-risk.html
8/18/19 https://cmpassocregulationblog.blogspot.com/2019/08/global-decline-of-yields-of-government.html
8/11/19 https://cmpassocregulationblog.blogspot.com/2019/08/competitive-exchange-rate-policies.html
8/4/19 https://cmpassocregulationblog.blogspot.com/2019/08/dollar-appreciation-contraction-of.html
7/28/19 https://cmpassocregulationblog.blogspot.com/2019/07/dollar-appreciation-in-anticipations-of.html
7/21/2019 https://cmpassocregulationblog.blogspot.com/2019/07/global-manufacturing-stress-world.html
7/14/19 https://cmpassocregulationblog.blogspot.com/2019/07/fomc-uncertain-outlook-frank-h-knights.html
7/7/19 https://cmpassocregulationblog.blogspot.com/2019/07/twenty-million-unemployed-or.html
6/30/19 https://cmpassocregulationblog.blogspot.com/2019/06/mediocre-cyclical-united-states.html
6/23/2019 https://cmpassocregulationblog.blogspot.com/2019/06/fomc-outlook-uncertainty-central-bank.html
6/16/2019 https://cmpassocregulationblog.blogspot.com/2019/06/recovery-without-hiring-ten-million.html
5/5/19 https://cmpassocregulationblog.blogspot.com/2019/05/fluctuating-valuations-of-risk.html
4/21/19 https://cmpassocregulationblog.blogspot.com/2019/04/increasing-valuations-of-risk-financial.html
3/31/19 https://cmpassocregulationblog.blogspot.com/2019/03/inverted-yield-curve-of-treasury_30.html
12/9/18 https://cmpassocregulationblog.blogspot.com/2018/12/fluctuation-of-valuations-of-risk.html
11/4/18 https://cmpassocregulationblog.blogspot.com/2018/10/contraction-of-valuations-of-risk.html
1/7/18 https://cmpassocregulationblog.blogspot.com/2018/01/twenty-three-million-unemployed-or.html
12/31/17 https://cmpassocregulationblog.blogspot.com/2017/12/dollar-devaluation-cyclically.html
12/24/17 https://cmpassocregulationblog.blogspot.com/2017/12/mediocre-cyclical-united-states_23.html
10/29/17 https://cmpassocregulationblog.blogspot.com/2017/10/dollar-revaluation-and-increase-of.html
4/2/17 https://cmpassocregulationblog.blogspot.com/2017/04/mediocre-cyclical-economic-growth-with.html
1/15/17 http://cmpassocregulationblog.blogspot.com/2017/01/unconventional-monetary-policy-and.html
1/1/17 http://cmpassocregulationblog.blogspot.com/2017/01/rules-versus-discretionary-authorities.html
12/25/16 http://cmpassocregulationblog.blogspot.com/2016/12/mediocre-cyclical-united-states.html
10/16/16 http://cmpassocregulationblog.blogspot.com/2016/10/imf-view-of-world-economy-and-finance.html
9/25/16 http://cmpassocregulationblog.blogspot.com/2016/09/the-economic-outlook-is-inherently.html
7/24/16 http://cmpassocregulationblog.blogspot.com/2016/07/unresolved-us-balance-of-payments.html
4/10/16 http://cmpassocregulationblog.blogspot.com/2016/04/proceeding-cautiously-in-reducing.html
1/17/16 http://cmpassocregulationblog.blogspot.com/2016/01/unconventional-monetary-policy-and.html
1/3/16 http://cmpassocregulationblog.blogspot.com/2016/01/weakening-equities-and-dollar.html
10/11/15 http://cmpassocregulationblog.blogspot.com/2015/10/interest-rate-policy-uncertainty-imf.html
6/21/15 http://cmpassocregulationblog.blogspot.com/2015/06/fluctuating-financial-asset-valuations.html
5/10/15 http://cmpassocregulationblog.blogspot.com/2015/05/quite-high-equity-valuations-and.html
4/26/2015 http://cmpassocregulationblog.blogspot.com/2015/04/imf-view-of-economy-and-finance-united.html
4/19/2015 http://cmpassocregulationblog.blogspot.com/2015/04/global-portfolio-reallocations-squeeze.html
4/12/15 http://cmpassocregulationblog.blogspot.com/2015/04/dollar-revaluation-recovery-without.html
4/5/15 http://cmpassocregulationblog.blogspot.com/2015/04/volatility-of-valuations-of-financial.html
3/22/15 http://cmpassocregulationblog.blogspot.com/2015/03/impatience-with-monetary-policy-of.html
3/1/15 http://cmpassocregulationblog.blogspot.com/2015/03/irrational-exuberance-mediocre-cyclical.html
2/1/15 http://cmpassocregulationblog.blogspot.com/2015/02/financial-and-international.html
9/14/14 http://cmpassocregulationblog.blogspot.com/2014/09/geopolitics-monetary-policy-and.html
8/24/14 http://cmpassocregulationblog.blogspot.com/2014/08/monetary-policy-world-inflation-waves.html
2/16/14 http://cmpassocregulationblog.blogspot.com/2014/02/theory-and-reality-of-cyclical-slow.html
9/22/13 http://cmpassocregulationblog.blogspot.com/2013/09/duration-dumping-and-peaking-valuations.html
2/10/13 http://cmpassocregulationblog.blogspot.com/2013/02/united-states-unsustainable-fiscal.html
Table VA-1 provides the value of total sales of US business (manufacturers, retailers and merchant wholesalers) and monthly and 12-month percentage changes. Sales of manufacturers decreased 13.5 percent in Apr and decreased 5.5 percent in Mar, decreasing 19.4 percent in the 12 months ending in Apr 2020 in the global recession, with output in the US reaching a high in Feb 2020 (https://www.nber.org/cycles.html), in the lockdown of economic activity in the COVID-19 event.. Sales of retailers decreased 12.7 percent in Apr and decreased 5.1 percent in Mar, decreasing 14.8 percent in 12 months. Sales of merchant wholesalers decreased 16.9 percent in Apr, decreasing 5.1 percent in Mar and decreasing 20.6 percent in 12 months. Total business sales decreased 14.4 percent in Apr and decreased 5.2 percent in Mar, decreasing 18.4 percent in the 12 months ending in Apr 2020.
Table VA-1, US, Percentage Changes for Sales of Manufacturers, Retailers and Merchant Wholesalers
Apr 20/Mar 20 | Apr 2020 | Mar 20/ Feb 20 ∆% SA | Apr 20/ Apr 19 | |
Total Business | -14.4 | 1,187,903 | -5.2 | -18.4 |
Manufacturers | -13.5 | 406,579 | -5.5 | -19.4 |
Retailers | -12.7 | 380,178 | -5.1 | -14.8 |
Merchant Wholesalers | -16.9 | 401,146 | -5.1 | -20.6 |
Source: US Census Bureau https://www.census.gov/mtis/index.html
Chart VA-1 of the US Census Bureau provides total US sales of manufacturing, retailers and wholesalers seasonally adjusted (SA) in millions of dollars. The series with adjustment evens fluctuations following seasonal patterns. There is sharp recovery from the global recession in a robust trend, which is mixture of price and quantity effects because data are not adjusted for price changes. There is stability in the final segment with subdued prices with data not adjusted for price changes. There is recovery in the recent segment with occasional vacillation. The final data point in Apr 2020 show sharp contraction in the global recession, with output in the US reaching a high in Feb 2020 (https://www.nber.org/cycles.html), in the lockdown of economic activity in the COVID-19 event.
Chart VA-1, US, Total Business Sales of Manufacturers, Retailers and Merchant Wholesalers, SA, Millions of Dollars, Jan 1992-Apr 2020
Source: US Census Bureau https://www.census.gov/mtis/index.html
Chart VA-1A shows of the US Census Bureau provides total US sales of manufacturing, retailers and wholesalers seasonally adjusted (SA) in millions of dollars from Jan 2019 to Apr 2020, showing the deep contraction in Mar-Apr 2020 in the global recession, with output in the US reaching a high in Feb 2020 (https://www.nber.org/cycles.html), in the lockdown of economic activity in the COVID-19 event.
Chart VA-1A, US, Total Business Sales of Manufacturers, Retailers and Merchant Wholesalers, SA, Millions of Dollars, Jan 2019-Apr 2020
Source: US Census Bureau https://www.census.gov/mtis/index.html
Chart VA-2 of the US Census Bureau provides total US sales of manufacturing, retailers and wholesalers not seasonally adjusted (NSA) in millions of dollars from Jan 1992 to Apr 2020. The series without seasonal adjustment shows sharp jagged behavior because of monthly fluctuations following seasonal patterns. There is sharp recovery from the global recession in a robust trend, which is mixture of price and quantity effects because data are not adjusted for price changes. There is stability in the final segment with monthly marginal weakness in data without adjustment for price changes with following recovery. There is sharp contraction in Mar-Apr 2020 in the global recession, with output in the US reaching a high in Feb 2020 (https://www.nber.org/cycles.html), in the lockdown of economic activity in the COVID-19 event.
Chart VA-2, US, Total Business Sales of Manufacturers, Retailers and Merchant Wholesalers, NSA, Millions of Dollars, Jan 1992-Apr 2020
Source: US Census Bureau
https://www.census.gov/mtis/index.html
Chart VA-2A of the US Census Bureau provides total US sales of manufacturing, retailers and wholesalers not seasonally adjusted (NSA) in millions of dollars from Jan 2019 to Apr 2020. There is sharp contraction in the final data point in Apr 2020 in the global recession, with output in the US reaching a high in Feb 2020 (https://www.nber.org/cycles.html), in the lockdown of economic activity in the COVID-19 event.
Chart VA-2A, US, Total Business Sales of Manufacturers, Retailers and Merchant Wholesalers, NSA, Millions of Dollars, Jan 2019-Apr 2020
Source: US Census Bureau
https://www.census.gov/mtis/index.html
Businesses added cautiously to inventories to replenish stocks. Retailers’ inventories decreased 3.7 percent in Apr 2020 and increased 1.1 percent in
Mar with decrease of 3.2 percent in 12 months, as shown in Table VA-2. Total business decreased inventories 1.3 percent in Apr decreasing 0.3 percent in Mar and decreasing 2.3 percent in 12 months. Inventories sales/ratios of total business stabilized at a level close to 1.30 under careful management to avoid costs and risks, increasing to 1.67 in Apr 2020. Inventory/sales ratios of manufacturers and retailers are higher than for merchant wholesalers. There is stability in inventory/sales ratios in individual months and relative to a year earlier with increase at the margin.
Inventory Change | Apr 20 | Apr 20/Mar 20 ∆% SA | Mar 20/ Feb 20 ∆% SA | Apr 20/Apr 19 ∆% NSA |
Total Business | 1,983,848 | -1.3 | -0.3 | -2.3 |
Manufacturers | 689,171 | -0.4 | -1.1 | -0.7 |
Retailers | 643,792 | -3.7 | 1.1 | -3.2 |
Merchant | 650,885 | 0.3 | -1.1 | -2.8 |
Inventory/ | Apr 20 | Apr 2020 SA | Mar 2020 SA | Apr 2019 SA |
Total Business | 1,983,848 | 1.67 | 1.45 | 1.39 |
Manufacturers | 689,171 | 1.69 | 1.46 | 1.38 |
Retailers | 643,792 | 1.68 | 1.53 | 1.47 |
Merchant Wholesalers | 650,885 | 1.65 | 1.36 | 1.34 |
US Census Bureau
https://www.census.gov/mtis/index.html
Chart VA-3 of the US Census Bureau provides total business inventories of manufacturers, retailers and merchant wholesalers seasonally adjusted (SA) in millions of dollars from Jan 1992 to Apr 2020. The impact of the two recessions of 2001 and IVQ2007 to IIQ2009 is evident in the form of sharp reductions in inventories. Inventories have surpassed the peak before the global recession. Data are not adjusted for price changes. Inventories decline in the global recession, with output in the US reaching a high in Feb 2020 (https://www.nber.org/cycles.html), in the lockdown of economic activity in the COVID-19 event.
Chart VA-3, US, Total Business Inventories of Manufacturers, Retailers and Merchant Wholesalers, SA, Millions of Dollars, Jan 1992-Apr 2020
Source: US Census Bureau https://www.census.gov/mtis/index.html
Chart VA-3A of the US Census Bureau provides total business inventories of manufacturers, retailers and merchant wholesalers seasonally adjusted (SA) in millions of dollars from Jan 2019 to Apr 2020. Inventories sink in the global recession, with output in the US reaching a high in Feb 2020 (https://www.nber.org/cycles.html), in the lockdown of economic activity in the COVID-19 event.
Chart VA-3A, US, Total Business Inventories of Manufacturers, Retailers and Merchant Wholesalers, SA, Millions of Dollars, Jan 2019-Apr 2020
Source: US Census Bureau https://www.census.gov/mtis/index.html
Chart VA-4 provides total business inventories of manufacturers, retailers and merchant wholesalers not seasonally adjusted (NSA) from Jan 1992 to Apr 2020 in millions of dollars. The recessions of 2001 and IVQ2007 to IIQ2009 are evident in the form of sharp reductions of inventories. There is sharp upward trend of inventory accumulation after both recessions. Total business inventories are higher than in the peak before the global recession. Inventories decrease in the global recession, with output in the US reaching a high in Feb 2020 (https://www.nber.org/cycles.html), in the lockdown of economic activity in the COVID-19 event.
Chart VA-4, US, Total Business Inventories of Manufacturers, Retailers and Merchant Wholesalers, NSA, Millions of Dollars, Jan 1992-Apr 2020
Source: US Census Bureau https://www.census.gov/mtis/index.html
Chart VA-4A provides total business inventories of manufacturers, retailers and merchant wholesalers not seasonally adjusted (SA) from Jan 1992 to Apr 2020 in millions of dollars. There is sharp contraction in Mar-Apr 2020 in the global recession, with output in the US reaching a high in Feb 2020 (https://www.nber.org/cycles.html), in the lockdown of economic activity in the COVID-19 event.
Chart VA-4A, US, Total Business Inventories of Manufacturers, Retailers and Merchant Wholesalers, NSA, Millions of Dollars, Jan 2019-Apr 2020
Source: US Census Bureau https://www.census.gov/mtis/index.html
Inventories follow business cycles. When recession hits sales inventories pile up, declining with expansion of the economy. In a fascinating classic opus, Lloyd Meltzer (1941, 129) concludes:
“The dynamic sequences (i) through (6) were intended to show what types of behavior are possible for a system containing a sales output lag. The following conclusions seem to be the most important:
(i) An economy in which business men attempt to recoup inventory losses will always undergo cyclical fluctuations when equilibrium is disturbed, provided the economy is stable.
This is the pure inventory cycle.
(2) The assumption of stability imposes severe limitations upon the possible size of the marginal propensity to consume, particularly if the coefficient of expectation is positive.
(3) The inventory accelerator is a more powerful de-stabilizer than the ordinary acceleration principle. The difference in stability conditions is due to the fact that the former allows for replacement demand whereas the usual analytical formulation of the latter does not. Thus, for inventories, replacement demand acts as a de-stabilizer. Whether it does so for all types of capital goods is a moot question, but I believe cases may occur in which it does not.
(4) Investment for inventory purposes cannot alter the equilibrium of income, which depends only upon the propensity to consume and the amount of non-induced investment.
(5) The apparent instability of a system containing both an accelerator and a coefficient of expectation makes further investigation of possible stabilizers highly desirable.”
Chart VA-5 shows the increase in the inventory/sales ratios during the recession of 2007-2009. The inventory/sales ratio fell during the expansions. The inventory/sales ratio declined to a trough in 2011, climbed and then stabilized at current levels in 2012, 2013 and 2015 with increase into 2015-2016 and then decreasing at the margin from 2016 into 2017-2019. Inventory/sales ratios increase sharply in the global recession, with output in the US reaching a high in Feb 2020 (https://www.nber.org/cycles.html), in the lockdown of economic activity in the COVID-19 event.
Chart VA-5, Total Business Inventories/Sales Ratios 2011 to 2020
https://www.census.gov/mtis/img/mtisbrf.gif
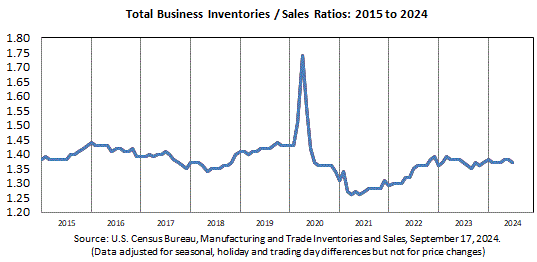
Sales of retail and food services increased 17.7 percent in May 2020, after decreasing 14.7 percent in Apr 2020 seasonally adjusted (SA), in the global recession, with output in the US reaching a high in Feb 2020 (https://www.nber.org/cycles.html), in the lockdown of economic activity in the COVID-19 event, decreasing 4.7 percent in May 2020 relative to May 2019 not seasonally adjusted (NSA), as shown in Table VA-3. Excluding motor vehicles and parts, retail sales increased 12.4 percent in May 2020, decreasing 15.2 percent in Apr 2020 SA and decreasing 3.2 percent NSA in May 2020 relative to a year earlier. Sales of motor vehicles and parts increased 44.1 percent in May 2020 after decreasing 12.3 percent in Apr 2020 SA and decreasing 10.5 percent NSA in May 2020 relative to a year earlier. Gasoline station sales increased 12.8 percent SA in May 2020 after decreasing 24.4 percent in May 2020 in oscillating prices of gasoline that are moderating, decreasing 16.7 percent in May 2020 relative to a year earlier.
Table VA-3, US, Percentage Change in Monthly Sales for Retail and Food Services, ∆%
May ∆% SA | Apr ∆% SA | Jan-May 2020 Million Dollars NSA | Jan-May 2020 from Jan-May 2019 ∆% NSA | |
Retail and Food Services | 17.7 | -14.7 | 2,358,235 | -4.7 |
Excluding Motor Vehicles and Parts | 12.4 | -15.2 | 1,909,858 | -3.2 |
Motor Vehicles & Parts Dealers | 44.1 | -12.3 | 448,377 | -10.5 |
Retail | 16.8 | -12.7 | 2,116,588 | -2.2 |
Building Materials | 10.9 | -2.4 | 167,426 | 6.7 |
Food and Beverage | 2.0 | -12.8 | 349,893 | 13.1 |
Grocery | 1.3 | -13.3 | 315,597 | 13.6 |
Health & Personal Care Stores | 0.4 | -14.8 | 144,410 | -2.4 |
Clothing & Clothing Accessories Stores | 188.0 | -75.2 | 57,400 | -42.9 |
Gasoline Stations | 12.8 | -24.4 | 166,761 | -16.7 |
General Merchandise Stores | 6.0 | -13.6 | 285,459 | 2.6 |
Food Services & Drinking Places | 29.1 | -34.6 | 241,647 | -22.3 |
Source: US Census Bureau https://www.census.gov/retail/index.html
Chart VA-6 provides monthly percentage changes of sales of retail and food services. There is significant monthly volatility that prevents identification of clear trends. Sales collapsed in Mar-Apr 2020, in the global recession, with output in the US reaching a high in Feb 2020 (https://www.nber.org/cycles.html), in the lockdown of economic activity in the COVID-19 event, with sharp recovery in May 2020.
Chart VA-6, US, Monthly Percentage Change of Retail and Food Services Sales, Jan 1992-May 2020
Source: US Census Bureau https://www.census.gov/retail/index.html
Chart VA-6A provides monthly percentage changes of sales of retail and food services from Jan 2019 to May 2020.There is vertical increase in May 2020 after collapse in Feb-Apr 2020.
Chart VA-6A, US, Monthly Percentage Change of Retail and Food Services Sales, Jan 2019-May 2020
Source: US Census Bureau https://www.census.gov/retail/index.html
Chart VA-7 of the US Census Bureau provides total sales of retail trade and food services seasonally adjusted (SA) from Jan 1992 to May 2020 in millions of dollars. The impact on sales of the shallow recession of 2001 was much milder than the sharp contraction in the global recession from IVQ2007 to IIQ2009. There is flattening in the final segment of the series followed by another increase/decrease. Sales collapsed in the lockdown of economic activity in the COVID-19 event. Data are not adjusted for price changes. There is sharp decline in Feb-Mar 2020 with sharp recovery in May 2020.
Chart VA-7, US, Total Sales of Retail Trade and Food Services, SA, Jan 1992-May 2020, Millions of Dollars
Source: US Census Bureau https://www.census.gov/retail/index.html
Chart VA-7 of the US Census Bureau provides total sales of retail trade and food services seasonally adjusted (SA) from Jan 2019 to May 2020 in millions of dollars. Sales jumped in May 2020 in recovery from the contraction in Feb-Mar 2020.
Chart VA-7A, US, Total Sales of Retail Trade and Food Services, SA, Jan 2019-May 2020, Millions of Dollars
Source: US Census Bureau https://www.census.gov/retail/index.html
Chart VA-8 of the US Census Bureau provides total sales of retail trade and food services seasonally adjusted (NSA) from Jan 1992 to May 2020 in millions of dollars. Data are not adjusted for price changes. There is sharp contraction in Feb-Apr 2020, in the global recession, with output in the US reaching a high in Feb 2020 (https://www.nber.org/cycles.html), in the lockdown of economic activity in the COVID-19 event, with sharp recovery in May 2020.
Chart VA-8, US, Total Sales of Retail Trade and Food Services, NSA, Jan 1992-Apr 2020, Millions of Dollars
Source: US Census Bureau https://www.census.gov/retail/index.html
Chart VA-8A of the US Census Bureau provides total sales of retail trade and food services seasonally adjusted (NSA) from Jan 2019 to May 2020 in millions of dollars. Data are not adjusted for price changes. There is sharp recovery in May 2020.
Chart VA-8A, US, Total Sales of Retail Trade and Food Services, NSA, Jan 2019-May 2020, Millions of Dollars
Source: US Census Bureau https://www.census.gov/retail/index.html
Table VI-7C provides additional information required for understanding the deficit/debt situation of the United States. The table is divided into four parts: Treasury budget in the 2020 fiscal year beginning on Oct 1, 2019 and ending on Sep 30, 2020; federal fiscal data for the years from 2009 to 2019; federal fiscal data for the years from 2005 to 2008; and Treasury debt held by the public from 2005 to 2019. Receipts decreased 11.2 percent in the cumulative fiscal year 2020 ending in May 2020 relative to the cumulative in fiscal year 2019. Individual income taxes decreased 23.1 percent relative to the same fiscal period a year earlier. Outlays increased 29.4 percent relative to a year earlier. There are also receipts, outlays, deficit and debt for fiscal years 2013, 2014, 2015, 2016, 2017, 2018 and 2019. In fiscal year 2019, the deficit reached $984.4 billion or 4.6 percent of GDP. Outlays of 4,446.6 billion were 21.0 percent of GDP and receipts of $3,462.2 billion were 16.3 percent of GDP. It is quite difficult for the US to raise receipts above 18 percent of GDP. Total revenues of the US from 2009 to 2012 accumulate to $9021.2 billion, or $9.0 trillion, while expenditures or outlays accumulate to $14,104.5 billion, or $14.1 trillion, with the deficit accumulating to $5083.3 billion, or $5.1 trillion. Revenues decreased 6.5 percent from $9652.5 billion in the four years from 2005 to 2008 to $9021.2 billion in the years from 2009 to 2012. Decreasing revenues were caused by the global recession from IVQ2007 (Dec) to IIQ2009 (Jun) and by growth of only 2.3 percent on average in the cyclical expansion from IIIQ2009 to IVQ2019. In contrast, the expansion from IQ1983 to IIIQ1993 was at the average annual growth rate of 3.6 percent and at 7.9 percent from IQ1983 to IVQ1983 (https://cmpassocregulationblog.blogspot.com/2020/05/mediocre-cyclical-united-states_31.html and earlier https://cmpassocregulationblog.blogspot.com/2020/05/mediocre-cyclical-united-states.html). Because of mediocre GDP growth, there are 47.4 million unemployed or underemployed in the United States for an effective unemployment/underemployment rate of 27.5 percent (https://cmpassocregulationblog.blogspot.com/2020/06/creation-of-three-million-private.html and earlier https://cmpassocregulationblog.blogspot.com/2020/05/fifty-two-million-unemployed-or.html). Weakness of growth and employment creation is analyzed in II Collapse of United States Dynamism of Income Growth and Employment Creation (https://cmpassocregulationblog.blogspot.com/2020/05/mediocre-cyclical-united-states.html). In contrast with the decline of revenue, outlays or expenditures increased 30.1 percent from $10,838.2 billion, or $10.8 trillion, in the four years from 2005 to 2008, to $14,104.5 billion, or $14.1 trillion, in the four years from 2009 to 2012. Increase in expenditures by 30.1 percent while revenue declined by 6.5 percent caused the increase in the federal deficit from $1185.8 billion in 2005-2008 to $5083.3 billion in 2009-2012. Federal revenue was 14.8 percent of GDP on average in the years from 2009 to 2012, which is well below 17.3 percent of GDP on average from 1962 to 2019. Federal outlays were 23.3 percent of GDP on average from 2009 to 2012, which is well above 20.1 percent of GDP on average from 1962 to 2019. The lower part of Table VI-7C shows that debt held by the public swelled from $5803 billion in 2008 to $13,117 billion in 2015, by $7314 billion or 126.0 percent. Debt held by the public as percent of GDP or economic activity jumped from 39.4 percent in 2008 to 79.2 percent in 2019, which is well above the average of 41.7 percent from 1962 to 2019. The United States faces tough adjustment because growth is unlikely to recover, creating limits on what can be obtained by increasing revenues, while continuing stress of social programs restricts what can be obtained by reducing expenditures. The Congressional Budget Office (CBO) provides a preliminary estimate of the impact of Public Law 116-136 of Mar 27, 2020, CARES Act or Coronavirus Aid, Relief and Economic Security Act (https://www.cbo.gov/system/files/2020-04/hr748.pdf). This preliminary estimate finds that the CARES Act “will increase federal deficits by about $1.8 trillion over the 2020-2030 period (https://www.cbo.gov/system/files/2020-04/hr748.pdf).
Table VI-7C, US, Treasury Budget in Fiscal Year to Date Million Dollars
May 2020 | Fiscal Year 2020 | Fiscal Year 2019 | ∆% |
Receipts | 2,019,240 | 2,274,902 | -11.2 |
Outlays | 3,899,536 | 3,013,541 | 29.4 |
Deficit | -1,880,296 | -738,638 | |
Individual Income Tax | 892,477 | 1,160,328 | -23.1 |
Corporation Income Tax | 86,399 | 113,086 | -23.6 |
Social Insurance | 637,597 | 605,046 | 5.4 |
Receipts | Outlays | Deficit (-), Surplus (+) | |
$ Billions | |||
Fiscal Year 2019 | 3,462.2 | 4,446.6 | -984.4 |
% GDP | 16.3 | 21.0 | -4.6 |
Fiscal Year 2018 | 3,329.9 | 4,109.0 | -779.1 |
% GDP | 16.4 | 20.2 | -3.8 |
Fiscal Year 2017 | 3,316.2 | 3,981.6 | -665.4 |
% GDP | 17.2 | 20.6 | -3.5 |
Fiscal Year 2016 | 3,268.0 | 3,852.6 | -584.7 |
% GDP | 17.6 | 20.8 | -3.2 |
Fiscal Year 2015 | 3,249.9 | 3,691.8 | -442.0 |
% GDP | 18.0 | 20.4 | -2.4 |
Fiscal Year 2014 | 3,021.5 | 3,506.3 | -484.8 |
% GDP | 17.4 | 20.2 | -2.8 |
Fiscal Year 2013 | 2,775.1 | 3,454.9 | -679.8 |
% GDP | 16.7 | 20.8 | -4.1 |
Fiscal Year 2012 | 2,450.0 | 3,526.6 | -1,076.6 |
% GDP | 15.3 | 22.0 | -6.7 |
Fiscal Year 2011 | 2,303.5 | 3,603.1 | -1,299.6 |
% GDP | 15.0 | 23.4 | -8.4 |
Fiscal Year 2010 | 2,162.7 | 3,457.1 | -1,294.4 |
% GDP | 14.6 | 23.3 | -8.7 |
Fiscal Year 2009 | 2,105.0 | 3,517.7 | -1,412.7 |
% GDP | 14.6 | 24.4 | -9.8 |
Total 2009-2012 | 9,021.2 | 14,104.5 | -5,083.3 |
Average % GDP 2009-2012 | 14.8 | 23.3 | -8.4 |
Fiscal Year 2008 | 2,524.0 | 2,982.5 | -458.6 |
% GDP | 17.1 | 20.2 | -3.1 |
Fiscal Year 2007 | 2,568.0 | 2,728.7 | -160.7 |
% GDP | 18.0 | 19.1 | -1.1 |
Fiscal Year 2006 | 2,406.9 | 2,655.1 | -248.2 |
% GDP | 17.6 | 19.5 | -1.8 |
Fiscal Year 2005 | 2,153.6 | 2,472.0 | -318.3 |
% GDP | 16.8 | 19.3 | -2.5 |
Total 2005-2008 | 9,652.5 | 10,838.2 | -1,185.8 |
Average % GDP 2005-2008 | 17.4 | 19.5 | -2.1 |
Debt Held by the Public | Billions of Dollars | Percent of GDP | |
2005 | 4,592 | 35.8 | |
2006 | 4,829 | 35.4 | |
2007 | 5,035 | 35.2 | |
2008 | 5,803 | 39.4 | |
2009 | 7,545 | 52.3 | |
2010 | 9,019 | 60.8 | |
2011 | 10,128 | 65.8 | |
2012 | 11,281 | 70.3 | |
2013 | 11,983 | 72.2 | |
2014 | 12,780 | 73.7 | |
2015 | 13,117 | 72.5 | |
2016 | 14,168 | 76.4 | |
2017 | 14,666 | 76.0 | |
2018 | 15,750 | 77.4 | |
2019 | 16,803 | 79.2 |
Source: https://www.fiscal.treasury.gov/reports-statements/mts/
https://www.treasury.gov/press-center/press-releases/Pages/sm0184.aspx https://home.treasury.gov/news/press-releases/sm806 CBO, The budget and economic outlook: 2018 to 2028. Washington, DC, Apr 9 https://www.cbo.gov/publication/53651
CBO, The budget and economic outlook: 2017-2027. Washington, DC, Jan 24, 2017 https://www.cbo.gov/publication/52370 CBO, An update to the budget and economic outlook: 2016 to 2026. Washington, DC, Aug 23, 2016.
https://www.cbo.gov/about/products/budget-economic-data#6
CBO (2012NovMBR). CBO (2011AugBEO); Office of Management and Budget 2011. Historical Tables. Budget of the US Government Fiscal Year 2011. Washington, DC: OMB; CBO. 2011JanBEO. Budget and Economic Outlook. Washington, DC, Jan. CBO. 2012AugBEO. Budget and Economic Outlook. Washington, DC, Aug 22. CBO. 2012Jan31. Historical budget data. Washington, DC, Jan 31. CBO. 2012NovCDR. Choices for deficit reduction. Washington, DC. Nov. CBO. 2013HBDFeb5. Historical budget data—February 2013 baseline projections. Washington, DC, Congressional Budget Office, Feb 5. CBO. 2013HBDFeb5. Historical budget data—February 2013 baseline projections. Washington, DC, Congressional Budget Office, Feb 5. CBO (2013Aug12). 2013AugHBD. Historical budget data—August 2013. Washington, DC, Congressional Budget Office, Aug. CBO, Historical Budget Data—February 2014, Washington, DC, Congressional Budget Office, Feb. CBO, Historical budget data—April 2014 release. Washington, DC, Congressional Budget Office, Apr. Congressional Budget Office, August 2014 baseline: an update to the budget and economic outlook: 2014 to 2024. Washington, DC, CBO, Aug 27, 2014. CBO, Monthly budget review: summary of fiscal year 2014. Washington, DC, Congressional Budget Office, Nov 10, 2014. CBO, The budget and economic outlook: 2015 to 2025. Washington, DC, Congressional Budget Office, Jan 26, 2015.
https://www.cbo.gov/about/products/budget-economic-data#6
https://www.cbo.gov/about/products/budget_economic_data#3 https://www.cbo.gov/about/products/budget_economic_data#2
Risk aversion channels funds toward US long-term and short-term securities that finance the US balance of payments and fiscal deficits benefitting from risk flight to US dollar denominated assets. There are now temporary interruptions because of fear of rising interest rates that erode prices of US government securities because of mixed signals on monetary policy and exit from the Fed balance sheet of four trillion dollars of securities held outright. Net foreign purchases of US long-term securities (row C in Table VA-4) weakened from minus $138.8 billion in Mar 2020 to minus $155.1 billion in Apr
2020. Foreign residents’ purchases minus sales of US long-term securities (row A in Table VA-4) in Mar 2020 of minus $227.1 billion strengthened to minus $150.2 billion in Apr 2020. Net US (residents) purchases of long-term foreign securities (row B in Table VA-4) weakened from $115.5 billion in Mar 2020 to $21.8 billion in Apr 2020. Other transactions (row C2 in Table VA-4) changed from minus $27.2 billion in Mar 2020 to minus $26.7 billion in Apr 2020. In Apr 2020,
C = A + B + C2 = -$150.2 billion + $21.8 billion - $26.7 billion = -$155.1 billion.
There are minor rounding errors. There is strengthening demand in Table VA-4 in Apr 2020 in A1 private purchases by residents overseas of US long-term securities of minus $104.9 billion of which strengthening in A11 Treasury securities of minus $130.3 billion, weakening in A12 of $12.1 billion in agency securities, strengthening of 8.8 billion of corporate bonds and strengthening of $4.5 billion in equities. Worldwide risk aversion causes flight into US Treasury obligations with significant oscillations. Official purchases of securities in row A2 decreased $45.3 billion with decrease of Treasury securities of $46.4 billion in Apr 2020. Official purchases of agency securities increased $9.0 billion in Apr 2020. Row D shows increase in Apr 2020 of $207.5 billion in purchases of short-term dollar denominated obligations. Foreign holdings of US Treasury bills increased $148.8 billion (row D1) with foreign official holdings increasing $47.8 billion while the category “other” increased $58.7 billion. Foreign private holdings of US Treasury bills increased $101.0 billion in what could be arbitrage of duration exposures and international risks. Risk aversion of default losses in foreign securities dominates decisions to accept zero interest rates in Treasury securities with no perception of principal losses. In the case of long-term securities, investors prefer to sacrifice inflation and possible duration risk to avoid principal losses with significant oscillations
in risk perceptions.
Table VA-4, Net Cross-Borders Flows of US Long-Term Securities, Billion Dollars, NSA
Apr 2019 12 Months | Apr 2020 12 Months | Mar 2020 | Apr 2020 | |
A Foreign Purchases less Sales of | 15.7 | -152.7 | -227.1 | -150.2 |
A1 Private | 192.4 | 54.6 | -197.7 | -104.9 |
A11 Treasury | 207.6 | -201.2 | -237.7 | -130.3 |
A12 Agency | 135.9 | 235.8 | 38.7 | 12.1 |
A13 Corporate Bonds | 57.4 | -45.4 | -2.5 | 8.8 |
A14 Equities | -208.4 | 65.5 | 3.8 | 4.5 |
A2 Official | -176.8 | -207.3 | -29.5 | -45.3 |
A21 Treasury | -250.4 | -372.3 | -61.2 | -46.4 |
A22 Agency | 90.3 | 143.2 | 22.8 | 9.0 |
A23 Corporate Bonds | -10.5 | 8.1 | 5.7 | 2.2 |
A24 Equities | -6.1 | 13.8 | 3.3 | -10.1 |
B Net US Purchases of LT Foreign Securities | 298.1 | 317.0 | 115.5 | 21.8 |
B1 Foreign Bonds | 283.6 | 254.4 | 112.7 | 9.1 |
B2 Foreign Equities | 14.5 | 62.6 | 2.8 | 12.8 |
C1 Net Transactions | 313.7 | 164.3 | -111.6 | -128.4 |
C2 Other | -156.4 | -284.0 | -27.2 | -26.7 |
C Net Foreign Purchases of US LT Securities | 157.3 | -119.7 | -138.8 | -155.1 |
D Increase in Foreign Holdings of Dollar Denominated Short-term | ||||
US Securities & Other Liab | 379.1 | 268.7 | 5.8 | 207.5 |
D1 US Treasury Bills | 23.9 | 132.7 | -4.0 | 148.8 |
D11 Private | 39.2 | 109.5 | 18.9 | 101.0 |
D12 Official | -15.3 | 23.2 | -22.9 | 47.8 |
D2 Other | 355.2 | 136.0 | 9.8 | 58.7 |
C1 = A + B; C = C1+C2
A = A1 + A2
A1 = A11 + A12 + A13 + A14
A2 = A21 + A22 + A23 + A24
B = B1 + B2
D = D1 + D2
Sources: United States Treasury
https://www.treasury.gov/resource-center/data-chart-center/tic/Pages/ticpress.aspx
http://www.treasury.gov/press-center/press-releases/Pages/jl2609.aspx
Table VA-5 provides major foreign holders of US Treasury securities. China is the second largest holder with $1072.8 billion in Apr 2020, decreasing 0.8 percent from $1081.6 billion in Mar 2020 while decreasing $40.2 billion from Apr 2019 or 3.6 percent. The United States Treasury estimates US government debt held by private investors at $13,886 billion in Mar 2020 (Fiscal Year 2020). China’s holding of US Treasury securities represents 7.7 percent of US government marketable interest-bearing debt held by private investors (https://www.fiscal.treasury.gov/reports-statements/treasury-bulletin/). Min Zeng, writing on “China plays a big role as US Treasury yields fall,” on Jul 16, 2014, published in the Wall Street Journal (http://online.wsj.com/articles/china-plays-a-big-role-as-u-s-treasury-yields-fall-1405545034?tesla=y&mg=reno64-wsj), finds that acceleration in purchases of US Treasury securities by China has been an important factor in the decline of Treasury yields in 2014. Japan increased its holdings from $1064.0 billion in Apr 2019 to $1266.0 billion in Apr 2020 or 19.0 percent. The combined holdings of China and Japan in Apr 2020 add to $2338.8 billion, which is equivalent to 16.8 percent of US government marketable interest-bearing securities held by investors of $13,886 billion in Mar 2020 (Fiscal Year 2020) (https://www.fiscal.treasury.gov/reports-statements/treasury-bulletin/). Total foreign holdings of Treasury securities increased from $6433.9 billion in Apr 2019 to $6765.6 billion in Apr 2020, or 5.2 percent. The US continues to finance its fiscal and balance of payments deficits with foreign savings (see Pelaez and Pelaez, The Global Recession Risk (2007). Professor Martin Feldstein, at Harvard University, writing on “The Debt Crisis Is Coming Soon,” published in the Wall Street Journal on Mar 20, 2019 (https://www.wsj.com/articles/the-debt-crisis-is-coming-soon-11553122139?mod=hp_opin_pos3), foresees a US debt crisis with deficits moving above $1 trillion and debt above 100 percent of GDP. A point of saturation of holdings of US Treasury debt may be reached as foreign holders evaluate the threat of reduction of principal by dollar devaluation and reduction of prices by increases in yield, including possibly risk premium. Shultz et al (2012) find that the Fed financed three-quarters of the US deficit in fiscal year 2011, with foreign governments financing significant part of the remainder of the US deficit while the Fed owns one in six dollars of US national debt. Concentrations of debt in few holders are perilous because of sudden exodus in fear of devaluation and yield increases and the limit of refinancing old debt and placing new debt. In their classic work on “unpleasant monetarist arithmetic,” Sargent and Wallace (1981, 2) consider a regime of domination of monetary policy by fiscal policy (emphasis added):
“Imagine that fiscal policy dominates monetary policy. The fiscal authority independently sets its budgets, announcing all current and future deficits and surpluses and thus determining the amount of revenue that must be raised through bond sales and seignorage. Under this second coordination scheme, the monetary authority faces the constraints imposed by the demand for government bonds, for it must try to finance with seignorage any discrepancy between the revenue demanded by the fiscal authority and the amount of bonds that can be sold to the public. Suppose that the demand for government bonds implies an interest rate on bonds greater than the economy’s rate of growth. Then if the fiscal authority runs deficits, the monetary authority is unable to control either the growth rate of the monetary base or inflation forever. If the principal and interest due on these additional bonds are raised by selling still more bonds, so as to continue to hold down the growth of base money, then, because the interest rate on bonds is greater than the economy’s growth rate, the real stock of bonds will growth faster than the size of the economy. This cannot go on forever, since the demand for bonds places an upper limit on the stock of bonds relative to the size of the economy. Once that limit is reached, the principal and interest due on the bonds already sold to fight inflation must be financed, at least in part, by seignorage, requiring the creation of additional base money.”
Table VA-5, US, Major Foreign Holders of Treasury Securities $ Billions at End of Period
Apr 2020 | Mar 2020 | Apr 2019 | |
Total | 6765.6 | 6810.3 | 6433.9 |
Japan | 1266.0 | 1271.7 | 1064.0 |
China | 1072.8 | 1081.6 | 1113.0 |
United Kingdom | 368.5 | 395.3 | 300.8 |
Ireland | 300.2 | 271.5 | 269.7 |
Luxembourg | 265.5 | 246.1 | 223.7 |
Brazil | 259.5 | 264.4 | 306.7 |
Hong Kong | 242.8 | 245.3 | 207.2 |
Switzerland | 241.3 | 244.6 | 226.9 |
Belgium | 210.2 | 206.1 | 179.8 |
Cayman Islands | 206.8 | 207.2 | 217.2 |
Taiwan | 201.7 | 205.0 | 171.1 |
India | 157.4 | 156.5 | 155.3 |
Singapore | 146.1 | 151.5 | 139.3 |
France | 137.2 | 154.9 | 124.7 |
Foreign Official Holdings | 4047.4 | 4117.9 | 4070.9 |
A. Treasury Bills | 331.0 | 283.2 | 307.8 |
B. Treasury Bonds and Notes | 3716.4 | 3834.6 | 3763.1 |
Source: United States Treasury
http://www.treasury.gov/resource-center/data-chart-center/tic/Pages/ticpress.aspx
http://www.treasury.gov/resource-center/data-chart-center/tic/Pages/index.aspx
https://ticdata.treasury.gov/Publish/mfh.txt
VB Japan. The GDP of Japan grew at 1.0 percent per year on average from 1991 to 2002, with the GDP implicit deflator falling at 0.8 percent per year on average. The average growth rate of Japan’s GDP was 4 percent per year on average from the middle of the 1970s to 1992 (Ito 2004). Low growth in Japan in the 1990s is commonly labeled as “the lost decade” (see Pelaez and Pelaez, The Global Recession Risk (2007), 81-115). Table VB-GDP provides annual growth rates of Japan’s GDP from 1995 to 2019. Growth weakened from 2.7 per cent in 1995 and 3.1 percent in 1996 to contractions of 1.1 percent in 1998 and 0.3 percent in 1999. Growth rates were below 2 percent with exception of 2.8 percent in 2000 and 2.2 percent in 2004. Japan’s GDP contracted sharply by 1.1 percent in 2008 and 5.4 percent in 2009. As in most advanced economies, growth was robust at 4.2 percent in 2010 but mediocre at minus 0.1 percent in 2011 because of the tsunami and 1.5 percent in 2012. Japan’s GDP grew 2.0 percent in 2013 and nearly stagnated in 2014 at 0.4 percent. The GDP of Japan increased 1.2 percent in 2015 and 0.5 percent in 2016. Japan’s GDP increased at 2.2 percent in 2017. The GDP of Japan increased 0.3 percent in 2018. The GDP of Japan increased 0.7 percent in 2019. There is classic research on analyzing deviations of output from trend (see for example Schumpeter 1939, Hicks 1950, Lucas 1975, Sargent and Sims 1977). Japan’s real GDP in calendar year 2019 is 6.2 percent higher than in calendar year 2007 for growth at the average yearly rate of 0.5 percent. Japan’s real GDP grew 13.5 percent from the trough of 2009 to 2019 at the average yearly rate of 1.3 percent (https://www.cao.go.jp/index-e.html).
Table VB-GDP, Japan, Yearly Percentage Change of GDP ∆%
Calendar Year | ∆% |
1995 | 2.7 |
1996 | 3.1 |
1997 | 1.1 |
1998 | -1.1 |
1999 | -0.3 |
2000 | 2.8 |
2001 | 0.4 |
2002 | 0.1 |
2003 | 1.5 |
2004 | 2.2 |
2005 | 1.7 |
2006 | 1.4 |
2007 | 1.7 |
2008 | -1.1 |
2009 | -5.4 |
2010 | 4.2 |
2011 | -0.1 |
2012 | 1.5 |
2013 | 2.0 |
2014 | 0.4 |
2015 | 1.2 |
2016 | 0.5 |
2017 | 2.2 |
2018 | 0.3 |
2019 | 0.7 |
Source: Source: Japan Economic and Social Research Institute, Cabinet Office
https://www.cao.go.jp/index-e.html
http://wwwa.cao.go.jp/notice/20191101notice.html
Table VB-BOJF provides the forecasts of economic activity and inflation in Japan by the majority of members of the Policy Board of the Bank of Japan, which is part of their Outlook for Economic Activity and Prices (https://www.boj.or.jp/en/mopo/outlook/gor1504b.pdf) with changes on Jul 21, 2015 (https://www.boj.or.jp/en/announcements/release_2015/k150121a.pdf). For fiscal 2015, the forecast is of growth of GDP between 1.5 to 2.1 percent, with the all items CPI less fresh food 0.2 to 1.2 to 3.3 percent (https://www.boj.or.jp/en/mopo/outlook/gor1504b.pdf). The critical difference is forecast of the CPI excluding fresh food of 0.2 to 1.2 percent in 2015 and 1.2 to 2.2 percent in 2016 (https://www.boj.or.jp/en/mopo/outlook/gor1504b.pdf). Consumer price inflation in Japan excluding fresh food was minus 0.4 percent in Mar 2014 and 2.2 percent in 12 months (http://www.stat.go.jp/english/data/cpi/1581.htm), significantly because of the increase of the tax on value added of consumption in Apr 2014. The new monetary policy of the Bank of Japan aims to increase inflation to 2 percent. These forecasts are biannual in Apr and Oct. The Cabinet Office, Ministry of Finance and Bank of Japan released on Jan 22, 2013, a “Joint Statement of the Government and the Bank of Japan on Overcoming Deflation and Achieving Sustainable Economic Growth” (http://www.boj.or.jp/en/announcements/release_2013/k130122c.pdf) with the important change of increasing the inflation target of monetary policy from 1 percent to 2 percent:
“The Bank of Japan conducts monetary policy based on the principle that the policy shall be aimed at achieving price stability, thereby contributing to the sound development of the national economy, and is responsible for maintaining financial system stability. The Bank aims to achieve price stability on a sustainable basis, given that there are various factors that affect prices in the short run.
The Bank recognizes that the inflation rate consistent with price stability on a sustainable basis will rise as efforts by a wide range of entities toward strengthening competitiveness and growth potential of Japan's economy make progress. Based on this recognition, the Bank sets the price stability target at 2 percent in terms of the year-on-year rate of change in the consumer price index.
Under the price stability target specified above, the Bank will pursue monetary easing and aim to achieve this target at the earliest possible time. Taking into consideration that it will take considerable time before the effects of monetary policy permeate the economy, the Bank will ascertain whether there is any significant risk to the sustainability of economic growth, including from the accumulation of financial imbalances.”
The Bank of Japan also provided explicit analysis of its view on price stability in a “Background note regarding the Bank’s thinking on price stability” (http://www.boj.or.jp/en/announcements/release_2013/data/rel130123a1.pdf http://www.boj.or.jp/en/announcements/release_2013/rel130123a.htm/). The Bank of Japan also amended “Principal terms and conditions for the Asset Purchase Program” (http://www.boj.or.jp/en/announcements/release_2013/rel130122a.pdf): “Asset purchases and loan provision shall be conducted up to the maximum outstanding amounts by the end of 2013. From January 2014, the Bank shall purchase financial assets and provide loans every month, the amount of which shall be determined pursuant to the relevant rules of the Bank.”
Financial markets in Japan and worldwide were shocked by new bold measures of “quantitative and qualitative monetary easing” by the Bank of Japan (http://www.boj.or.jp/en/announcements/release_2013/k130404a.pdf). The objective of policy is to “achieve the price stability target of 2 percent in terms of the year-on-year rate of change in the consumer price index (CPI) at the earliest possible time, with a time horizon of about two years” (http://www.boj.or.jp/en/announcements/release_2013/k130404a.pdf). The main elements of the new policy are as follows:
- Monetary Base Control. Most central banks in the world pursue interest rates instead of monetary aggregates, injecting bank reserves to lower interest rates to desired levels. The Bank of Japan (BOJ) has shifted back to monetary aggregates, conducting money market operations with the objective of increasing base money, or monetary liabilities of the government, at the annual rate of 60 to 70 trillion yen. The BOJ estimates base money outstanding at “138 trillion yen at end-2012) and plans to increase it to “200 trillion yen at end-2012 and 270 trillion yen at end 2014” (http://www.boj.or.jp/en/announcements/release_2013/k130404a.pdf).
- Maturity Extension of Purchases of Japanese Government Bonds. Purchases of bonds will be extended even up to bonds with maturity of 40 years with the guideline of extending the average maturity of BOJ bond purchases from three to seven years. The BOJ estimates the current average maturity of Japanese government bonds (JGB) at around seven years. The BOJ plans to purchase about 7.5 trillion yen per month (http://www.boj.or.jp/en/announcements/release_2013/rel130404d.pdf). Takashi Nakamichi, Tatsuo Ito and Phred Dvorak, wiring on “Bank of Japan mounts bid for revival,” on Apr 4, 2013, published in the Wall Street Journal (http://online.wsj.com/article/SB10001424127887323646604578401633067110420.html), find that the limit of maturities of three years on purchases of JGBs was designed to avoid views that the BOJ would finance uncontrolled government deficits.
- Seigniorage. The BOJ is pursuing coordination with the government that will take measures to establish “sustainable fiscal structure with a view to ensuring the credibility of fiscal management” (http://www.boj.or.jp/en/announcements/release_2013/k130404a.pdf).
- Diversification of Asset Purchases. The BOJ will engage in transactions of exchange traded funds (ETF) and real estate investment trusts (REITS) and not solely on purchases of JGBs. Purchases of ETFs will be at an annual rate of increase of one trillion yen and purchases of REITS at 30 billion yen.
- Bank Lending Facility and Growth Supporting Funding Facility. At the meeting on Feb 18, the Bank of Japan doubled the scale of these lending facilities to prevent their expiration in the near future (http://www.boj.or.jp/en/announcements/release_2014/k140218a.pdf).
Table VB-BOJF provides the forecasts of economic activity and inflation in Japan by the majority of members of the Policy Board of the Bank of Japan, which is part of their Outlook for Economic Activity and Prices (https://www.boj.or.jp/en/mopo/outlook/gor1701b.pdf) with changes on Feb 1, 2017 (https://www.boj.or.jp/en/mopo/outlook/gor1604b.pdf). On Jun 19, 2015, the Bank of Japan announced a “New Framework for Monetary Policy Meetings,” which provides for quarterly release of the forecasts of the economy and prices beginning in Jan 2016 (https://www.boj.or.jp/en/announcements/release_2015/rel150619a.pdf). For fiscal 2015, the forecast is of growth of GDP between 0.7 to 0.7 percent, with the all items CPI less fresh food of 0.0 percent (https://www.boj.or.jp/en/mopo/outlook/gor1604b.pdf). The critical difference is forecast of the CPI excluding fresh food of 0.0 to 0.2 percent in 2016 and 1.8 to 3.0 percent in 2017 (https://www.boj.or.jp/en/mopo/outlook/gor1604b.pdf). Consumer price inflation in Japan excluding fresh food was 0.1 percent in Mar 2016 and minus 0.3 percent in 12 months (http://www.stat.go.jp/english/data/cpi/1581.htm). The CPI increased significantly because of the increase of the tax on value added of consumption in Apr 2014. The new monetary policy of the Bank of Japan aims to increase inflation to 2 percent. These forecasts are biannual in Apr and Oct. The Cabinet Office, Ministry of Finance and Bank of Japan released on Jan 22, 2013, a “Joint Statement of the Government and the Bank of Japan on Overcoming Deflation and Achieving Sustainable Economic Growth” (http://www.boj.or.jp/en/announcements/release_2013/k130122c.pdf) with the important change of increasing the inflation target of monetary policy from 1 percent to 2 percent:
“The Bank of Japan conducts monetary policy based on the principle that the policy shall be aimed at achieving price stability, thereby contributing to the sound development of the national economy, and is responsible for maintaining financial system stability. The Bank aims to achieve price stability on a sustainable basis, given that there are various factors that affect prices in the short run.
The Bank recognizes that the inflation rate consistent with price stability on a sustainable basis will rise as efforts by a wide range of entities toward strengthening competitiveness and growth potential of Japan's economy make progress. Based on this recognition, the Bank sets the price stability target at 2 percent in terms of the year-on-year rate of change in the consumer price index.
Under the price stability target specified above, the Bank will pursue monetary easing and aim to achieve this target at the earliest possible time. Taking into consideration that it will take considerable time before the effects of monetary policy permeate the economy, the Bank will ascertain whether there is any significant risk to the sustainability of economic growth, including from the accumulation of financial imbalances.”
The Bank of Japan also provided explicit analysis of its view on price stability in a “Background note regarding the Bank’s thinking on price stability” (http://www.boj.or.jp/en/announcements/release_2013/data/rel130123a1.pdf http://www.boj.or.jp/en/announcements/release_2013/rel130123a.htm/). The Bank of Japan also amended “Principal terms and conditions for the Asset Purchase Program” (http://www.boj.or.jp/en/announcements/release_2013/rel130122a.pdf): “Asset purchases and loan provision shall be conducted up to the maximum outstanding amounts by the end of 2013. From January 2014, the Bank shall purchase financial assets and provide loans every month, the amount of which shall be determined pursuant to the relevant rules of the Bank.”
Financial markets in Japan and worldwide were shocked by new bold measures of “quantitative and qualitative monetary easing” by the Bank of Japan (http://www.boj.or.jp/en/announcements/release_2013/k130404a.pdf). The objective of policy is to “achieve the price stability target of 2 percent in terms of the year-on-year rate of change in the consumer price index (CPI) at the earliest possible time, with a time horizon of about two years” (http://www.boj.or.jp/en/announcements/release_2013/k130404a.pdf). The main elements of the new policy are as follows:
- Monetary Base Control. Most central banks in the world pursue interest rates instead of monetary aggregates, injecting bank reserves to lower interest rates to desired levels. The Bank of Japan (BOJ) has shifted back to monetary aggregates, conducting money market operations with the objective of increasing base money, or monetary liabilities of the government, at the annual rate of 60 to 70 trillion yen. The BOJ estimates base money outstanding at “138 trillion yen at end-2012) and plans to increase it to “200 trillion yen at end-2012 and 270 trillion yen at end 2014” (http://www.boj.or.jp/en/announcements/release_2013/k130404a.pdf).
- Maturity Extension of Purchases of Japanese Government Bonds. Purchases of bonds will be extended even up to bonds with maturity of 40 years with the guideline of extending the average maturity of BOJ bond purchases from three to seven years. The BOJ estimates the current average maturity of Japanese government bonds (JGB) at around seven years. The BOJ plans to purchase about 7.5 trillion yen per month (http://www.boj.or.jp/en/announcements/release_2013/rel130404d.pdf). Takashi Nakamichi, Tatsuo Ito and Phred Dvorak, wiring on “Bank of Japan mounts bid for revival,” on Apr 4, 2013, published in the Wall Street Journal (http://online.wsj.com/article/SB10001424127887323646604578401633067110420.html), find that the limit of maturities of three years on purchases of JGBs was designed to avoid views that the BOJ would finance uncontrolled government deficits.
- Seigniorage. The BOJ is pursuing coordination with the government that will take measures to establish “sustainable fiscal structure with a view to ensuring the credibility of fiscal management” (http://www.boj.or.jp/en/announcements/release_2013/k130404a.pdf).
- Diversification of Asset Purchases. The BOJ will engage in transactions of exchange traded funds (ETF) and real estate investment trusts (REITS) and not solely on purchases of JGBs. Purchases of ETFs will be at an annual rate of increase of one trillion yen and purchases of REITS at 30 billion yen.
- Bank Lending Facility and Growth Supporting Funding Facility. At the meeting on Feb 18, the Bank of Japan doubled the scale of these lending facilities to prevent their expiration in the near future (http://www.boj.or.jp/en/announcements/release_2014/k140218a.pdf).
- Quantitative and Qualitative Monetary Easing (QQE) with Negative Nominal Interest Rate. On January 29, 2016, the Policy Board of the Bank of Japan introduced a new policy to attain the “price stability target of 2 percent at the earliest possible time” (https://www.boj.or.jp/en/announcements/release_2016/k160129a.pdf). The new framework consists of three dimensions: quantity, quality and interest rate. The interest rate dimension consists of rates paid to current accounts that financial institutions hold at the Bank of Japan of three tiers zero, positive and minus 0.1 percent. The quantitative dimension consists of increasing the monetary base at the annual rate of 80 trillion yen. The qualitative dimension consists of purchases by the Bank of Japan of Japanese government bonds (JGBs), exchange traded funds (ETFs) and Japan real estate investment trusts (J-REITS).
- Quantitative and Qualitative Easing with Yield Curve Control. The Bank of Japan introduced a new approach, QQE with Yield Curve Control (“Quantitative and Qualitative Easing with Yield Curve Control”) at its policy meeting on Sep 21, 2016 (https://www.boj.or.jp/en/announcements/release_2016/k160921a.pdf). The policy consists of two measures. First “yield curve control” consists of controlling the long-term and short-term interest rates. The bank will fix the interest rates of policy balances held by financial institutions at the BOJ at minus 0.1 percent and will purchase Japanese Government Bonds (JGB) in the amount required to maintain the yield of the 10-year JGB at around zero percent. Second, “the inflation-overshooting commitment” consists of increasing base money to maintain the CPI price stability target above 2 percent.
Table VB-BOJF, Bank of Japan, Forecasts of the Majority of Members of the Policy Board, % Year on Year
Fiscal Year | Real GDP | CPI All Items Less Fresh Food | Excluding Effects of Consumption Tax Hikes |
2013 | |||
Apr 2014 | +2.2 to +2.3 | +0.8 | |
Jan 2014 | +2.5 to +2.9 [+2.7] | +0.7 to +0.9 [+0.7] | |
Oct 2013 | +2.6 to +3.0 [+2.7] | +0.6 to +1.0 [+0.7] | |
Jul 2013 | +2.5 to +3.0 [+2.8] | +0.5 to +0.8 [+0.6] | |
2014 | |||
Apr 2015 | -1.0 to -0.8 [-0.9] | +2.8 | +0.8 |
Jan 2015 | -0.6 to -0.4 [-0.5] | +2.9 to +3.2 [+2.9] | +0.9 to +1.2 [+0.9] |
Oct 2014 | +0.2 to +0.7 [+0.5] | +3.1 to +3.4 [+3.2] | +1.1 to +1.4 [+1.2] |
Jul 2014 | +0.6 to +1.3 [+1.0] | +3.2 to +3.5 [+3.3] | +1.2 to +1.5 [+1.3] |
Apr 2014 | +0.8 to +1.3 | +3.0 to +3.5 | +1.0 to +1.5 |
Jan 2014 | +0.9 to 1.5 [+1.4] | +2.9 to +3.6 [+3.3] | +0.9 to +1.6 [+1.3] |
Oct 2013 | +0.9 to +1.5 [+1.5] | +2.8 to +3.6 [+3.3] | +0.8 to +1.6 [+1.3] |
Jul 2013 | +0.8 to +1.5 [+1.3] | +2.7 to +3.6 [+3.3] | +0.7 to +1.6 [+1.3] |
2015 | |||
Feb 2016 | +0.7 to +0.7 [+0.7] | 0.0 | |
Jan 2016 | +1.0 to +1.3 [+1.1] | 0.0 to 0.2 [+0.1] | |
Oct 2015 | +0.8 to +1.4 [+1.2] | 0.0 to +0.4 [+0.1 | |
Jul 2015 | +1.5 to +1.9 [+1.7] | +0.3 to +1.0 [+0.7] | |
Apr 2015 | +1.5 to +2.1 [+2.0] | +0.2 to 1.2 [+0.8] | +0.2 to 1.2 [+0.8] |
Jan 2015 | +1.8 to +2.3 [+2.1] | +0.4 to +1.3 [+1.0] | +0.4 to +1.3 [+1.0] |
Oct 2014 | +1.2 to +1.7 [+1.5] | +1.8 to 2.6 [+2.4] | +1.1 to +1.9 [+1.7] |
Jul 2014 | +1.2 to +1.6 [+1.5] | +1.9 to +2.8 [+2.6] | +1.2 to +2.1 [+1.9] |
Apr 2014 | +1.2 to +1.5 | +1.9 to +2.8 | +1.2 to +2.1 |
Jan 2014 | +1.2 to +1.8 [+1.5] | +1.7 to +2.9 [+2.6] | +1.0 to +2.2 [+1.9] |
Oct 2013 | +1.3 to +1.8 [+1.5] | +1.6 to +2.9 [+2.6] | +0.9 to +2.2 [+1.9] |
Jul 2013 | +1.3 to +1.9 [+1.5] | +1.6 to +2.9 [+2.6] | +0.9 to +2.2 [+1.9] |
2016 | |||
Apr 2017 | +1.4 to +1.4 [+1.4] | -0.3 | |
Feb 2017 | +1.2 to +1.5 [+1.4] | -0.2 to -0.1 [-0.2] | |
Jul 2016 | +0.8 to +1.0 [+1.0] | 0.0 to +0.3 [0.5] | 0.0 to +0.3 [0.5] |
Apr 2016 | +0.8 to +1.4 [+1.2] | 0.0 to +0.8 [+0.5] | 0.0 to +0.8 [+0.5] |
Jan 2016 | +1.0 to +1.7 [+1.5] | 0.2 to +1.2 [+0.8] | |
Oct 2015 | +1.2 to +1.6 [+1.4] | +0.8 to +1.5 [+1.4] | |
Jul 2015 | +1.5 to 1.7 [+1.5] | +1.2 to +2.1 [+1.9] | |
Apr 2015 | +1.4 to +1.8 [+1.5] | +1.2 to +2.2 [+2.0] | +1.2 to +2.2 [+2.0] |
Jan 2015 | +1.5 to +1.7 [+1.6] | +1.5 to +2.3 [+2.2] | +1.5 to +2.3 [+2.2] |
Oct 2014 | +1.0 to +1.4 [+1.2] | +1.9 to 3.0 [+2.8] | +1.2 to 2.3 [+2.1] |
Jul 2014 | +1.0 to +1.5 [+1.3] | +2.0 to +3.0 [+2.8] | +1.3 to +2.3 [+2.1] |
Apr 2014 | +1.0 to +1.5 | +2.0 to +3.0 | +1.3 to +2.3 |
2017 | |||
Apr 2017 | +1.4 to +1.6 [+1.6] | +0.6 to +1.6 [+1.4] | |
Feb 2017 | +1.3 to +1.6 [+1.5] | +0.8 to +1.6 [+1.5] | |
Jul 2016 | 1.0 to +1.5 | +0.8 to +1.8 | +0.8 to +1.8 |
Apr 2016 | 0.0 to + +0.3 [+0.1] | 1.8 to +3.0 [+2.7] | 0.8 to +2.0 [+1.7 |
Jan 2016 | +0.1 to + 0.5 [+0.3] | +2.0 to +3.1 [+2.8] | + 1.0 to +2.1 [+1.8] |
Oct 2015 | +0.1 to +0.5 [+0.3] | +2.5 to +3.4 [+3.1] | +1.2 to 2.1 [+1.8] |
Jul 2015 | +0.1 to +0.5 [+0.2] | +2.7 to +3.4 [+3.1] | +1.4 to +2.1 [+1.8] |
Apr 2015 | +0.1 to +0.5 [+0.2] | +2.7 to +3.4 [+3.2] | +1.4 to +2.1 [+1.9] |
2018 | |||
Apr 2017 | +1.1 to +1.3 [+1.3] | +0.8 to +1.9 [+1.7] | |
Feb 2017 | +1.0 to +1.2 [+1.1] | +0.9 to +1.9 [+1.7] | |
Jul 2016 | +0.8 to +1.0 | +1.0 to +2.0 | +1.0 to +2.0 |
Apr 2016 | +0.6 to +1.2 [+1.0] | +1.0 to +2.1 [+1.9] | +1.0 to +2.1 [+1.9] |
2019 | |||
Apr 2017 | +0.6 to +0.7 [+0.7] | +1.4 to +2.5 [+2.4] | +0.9 to +2.0 [+1.9] |
Figures in brackets are the median of forecasts of Policy Board members
Source: Policy Board, Bank of Japan
Figures in brackets are the median of forecasts of Policy Board members
Source: Policy Board, Bank of Japan
https://www.boj.or.jp/en/announcements/release_2015/k150121a.pdf
https://www.boj.or.jp/en/announcements/release_2014/k140715a.pdf
https://www.boj.or.jp/en/mopo/outlook/gor1504b.pdf
https://www.boj.or.jp/en/mopo/outlook/gor1510b.pdf
https://www.boj.or.jp/en/mopo/outlook/gor1601b.pdf
https://www.boj.or.jp/en/mopo/outlook/gor1604b.pdf
https://www.boj.or.jp/en/mopo/outlook/gor1607b.pdf
https://www.boj.or.jp/en/mopo/outlook/gor1701b.pdf
https://www.boj.or.jp/en/mopo/outlook/gor1704b.pdf
The Jibun Bank Flash Japan Composite Output Index increased from 25.8 in Apr to 27.4 in May (https://www.markiteconomics.com/Public/Home/PressRelease/4a9ae69be6ab45ecbe7ad505e022abc6). The Jibun Bank Flash Japan Services Business Activity Index increased from 21.5 in Apr to 25.3 in May (https://www.markiteconomics.com/Public/Home/PressRelease/4a9ae69be6ab45ecbe7ad505e022abc6). The Jibun Bank Flash Japan Manufacturing PMI Index™ with the Flash Japan
Manufacturing PMI™ decreased from 34.7 in Apr to 31.7 in May
(https://www.markiteconomics.com/Public/Home/PressRelease/4a9ae69be6ab45ecbe7ad505e022abc6). Joe Hayes, Economist at HIS
Markit, finds sharp internal economy contraction (https://www.markiteconomics.com/Public/Home/PressRelease/4a9ae69be6ab45ecbe7ad505e022abc6).The Jibun Bank Composite Output PMI Index increased from 25.8 in Apr to 27.8 in May, indicating contracting business activity (https://www.markiteconomics.com/Public/Home/PressRelease/b1cbb76509df405fb5be519fdff1a840). The Jibun Bank Business Activity Index of Services increased to 26.5 in May from 21.5 in Apr (https://www.markiteconomics.com/Public/Home/PressRelease/b1cbb76509df405fb5be519fdff1a840). Joe Hayes, Economist at IHS Markit, finds contracting conditions (https://www.markiteconomics.com/Public/Home/PressRelease/b1cbb76509df405fb5be519fdff1a840). The Jibun Bank Japan Manufacturing Purchasing Managers’ Index™ (PMI™), seasonally adjusted, decreased from 41.9 in Apr to 38.4 in May (https://www.markiteconomics.com/Public/Home/PressRelease/2ed59b9ddfcf433fa54bf77eca825569). New orders decreased while new foreign orders decreased. Joe Hayes, Economist at IHS Markit, finds contracting conditions in manufacturing (https://www.markiteconomics.com/Public/Home/PressRelease/2ed59b9ddfcf433fa54bf77eca825569). Table JPY provides the country data table for Japan.
Table JPY, Japan, Economic Indicators
Historical GDP and CPI | 1981-2010 Real GDP Growth and CPI Inflation 1981-2010 |
Corporate Goods Prices | May ∆% -0.4 |
Consumer Price Index | Apr NSA ∆% -0.1; Apr 12 months NSA ∆% 0.1 |
Real GDP Growth | IQ2020 ∆%: -0.6 on IVQ2019; IQ2020 SAAR minus 2.2; |
Employment Report | Apr Unemployed 1.89 million Change in unemployed since last year: 130 thousand |
All Industry Indices | Mar month SA ∆% -3.8 Earlier Data: Blog 4/26/15 |
Industrial Production | Mar SA month ∆%: -3.7 Earlier Data: |
Machine Orders | Total Mar ∆% 3.0 Private ∆%: -3.9 Excluding Volatile Orders minus 0.4 Earlier Data: |
Tertiary Index | Mar month SA ∆% -4.2 Earlier Data: |
Wholesale and Retail Sales | Mar 12 months: Earlier Data: |
Family Income and Expenditure Survey | Apr 12-month ∆% total nominal consumption -11.0, real -11.1 Earlier Data: Blog 3/29/15 |
Trade Balance | Exports May 2020 12 months ∆%: -28.3 Imports May 12 months ∆% -26.2 Earlier Data: Blog 4/26/15 |
Links to blog comments in Table JPY: 6/7/20 https://cmpassocregulationblog.blogspot.com/2020/06/creation-of-three-million-private.html
5/24/2020 https://cmpassocregulationblog.blogspot.com/2020/05/recovery-without-hiring-twenty-million.html
5/3/20 https://cmpassocregulationblog.blogspot.com/2020/05/mediocre-cyclical-united-states.html
4/19/20 https://cmpassocregulationblog.blogspot.com/2020/04/contraction-of-united-states.html
4/5/2020 https://cmpassocregulationblog.blogspot.com/2020/04/lockdown-of-economic-activity-in.html
3/22/20 https://cmpassocregulationblog.blogspot.com/2020/03/sharp-contraction-of-valuations-of-risk.html
3/15/20 https://cmpassocregulationblog.blogspot.com/2020/03/financial-markets-stress-in.html
2/23/20 https://cmpassocregulationblog.blogspot.com/2020/02/declining-valuations-of-risk-financial.html
2/16/20 https://cmpassocregulationblog.blogspot.com/2020/02/recovery-without-hiring-in-lost.html
2/9/2020 https://cmpassocregulationblog.blogspot.com/2020/02/increasing-valuations-of-risk-financial.html
1/26/20 https://cmpassocregulationblog.blogspot.com/2020/01/declining-valuations-of-risk-financial.html
1/19/20 https://cmpassocregulationblog.blogspot.com/2020/01/rising-valuations-of-risk-financial.html
12/29/19 https://cmpassocregulationblog.blogspot.com/2019/12/diverging-economic-conditions-and.html
12/22/19 https://cmpassocregulationblog.blogspot.com/2019/12/oscillating-valuations-of-risk.html
12/15/19 https://cmpassocregulationblog.blogspot.com/2019/12/increase-in-valuations-of-risk_14.html
12/1/19 https://cmpassocregulationblog.blogspot.com/2019/11/fluctuating-valuations-of-risk.html
11/24/19 https://cmpassocregulationblog.blogspot.com/2019/11/oscillating-risk-financial-assets-world.html
11/17/19 https://cmpassocregulationblog.blogspot.com/2019/11/increasing-valuations-of-risk-financial_16.html
11/3/19 https://cmpassocregulationblog.blogspot.com/2019/11/decrease-of-fomc-policy-rate-monetary.html
10/27/19 https://cmpassocregulationblog.blogspot.com/2019/10/increasing-valuations-of-risk-financial_26.html
10/20/19 https://cmpassocregulationblog.blogspot.com/2019/10/dollar-depreciation-fluctuating.html
10/6/19 https://cmpassocregulationblog.blogspot.com/2019/10/volatility-of-valuations-of-risk.html
9/22/19 https://cmpassocregulationblog.blogspot.com/2019/09/uncertain-fomc-outlook-of-monetary.html
9/15/19 https://cmpassocregulationblog.blogspot.com/2019/09/competitive-exchange-rate-and-interest.html
9/8/19 https://cmpassocregulationblog.blogspot.com/2019/09/increase-in-valuations-of-risk.html
8/25/19 https://cmpassocregulationblog.blogspot.com/2019/08/contraction-of-valuations-of-risk.html
8/18/19 https://cmpassocregulationblog.blogspot.com/2019/08/global-decline-of-yields-of-government.html
8/4/19 https://cmpassocregulationblog.blogspot.com/2019/08/dollar-appreciation-contraction-of.html
7/21/2019 https://cmpassocregulationblog.blogspot.com/2019/07/global-manufacturing-stress-world.html
7/14/19 https://cmpassocregulationblog.blogspot.com/2019/07/fomc-uncertain-outlook-frank-h-knights.html
6/30/2019 https://cmpassocregulationblog.blogspot.com/2019/06/mediocre-cyclical-united-states.html
6/16/2019 https://cmpassocregulationblog.blogspot.com/2019/06/recovery-without-hiring-ten-million.html
5/26/19 https://cmpassocregulationblog.blogspot.com/2019/05/contraction-of-risk-financial-assets.html
3/17/19 https://cmpassocregulationblog.blogspot.com/2019/03/increasing-valuations-of-risk-financial.html
2/17/19 https://cmpassocregulationblog.blogspot.com/2019/02/dollar-revaluation-with-increases-in.html
11/18/18 https://cmpassocregulationblog.blogspot.com/2018/11/weakening-gdp-growth-in-major-economies.html
9/16/18 https://cmpassocregulationblog.blogspot.com/2018/09/recovery-without-hiring-in-lost.html
8/19/18 https://cmpassocregulationblog.blogspot.com/2018/08/world-inflation-waves-lost-economic.html
6/17/18 https://cmpassocregulationblog.blogspot.com/2018/06/fomc-increases-interest-rates-with.html
5/20/2018 https://cmpassocregulationblog.blogspot.com/2018/05/dollar-revaluation-united-states_24.html
3/11/18 https://cmpassocregulationblog.blogspot.com/2018/03/twenty-three-million-unemployed-or.html
2/18/18 https://cmpassocregulationblog.blogspot.com/2018/02/united-states-inflation-trend-or.html
12/17/17 https://cmpassocregulationblog.blogspot.com/2017/12/fomc-increases-interest-rates-with.html
9/10/17 https://cmpassocregulationblog.blogspot.com/2017/09/twenty-two-million-unemployed-or.html
8/20/17 https://cmpassocregulationblog.blogspot.com/2017/08/fluctuating-valuations-of-risk.html
5/21/17 https://cmpassocregulationblog.blogspot.com/2017/05/dollar-devaluation-world-inflation.html
3/12/17 https://cmpassocregulationblog.blogspot.com/2017/03/increasing-interest-rates-twenty-four.html
12/11/16 http://cmpassocregulationblog.blogspot.com/2016/12/rising-values-of-risk-financial-assets.html
11/20/16 http://cmpassocregulationblog.blogspot.com/2016/11/interest-rate-increase-could-well.html
9/11/16 http://cmpassocregulationblog.blogspot.com/2016/09/interest-rate-uncertainty-and-valuation.html
8/21/16 http://cmpassocregulationblog.blogspot.com/2016/08/interest-rate-policy-uncertainty-and.html
6/12/16 http://cmpassocregulationblog.blogspot.com/2016/06/considerable-uncertainty-about-economic.html
5/22/16 http://cmpassocregulationblog.blogspot.com/2016/05/most-fomc-participants-judged-that-if.html
3/13/16 http://cmpassocregulationblog.blogspot.com/2016/03/monetary-policy-and-fluctuations-of_13.html
12/13/15 http://cmpassocregulationblog.blogspot.com/2015/12/liftoff-of-interest-rates-with-volatile_17.html
11/22/15 http://cmpassocregulationblog.blogspot.com/2015/11/interest-rate-liftoff-followed-by.html
9/13/15 http://cmpassocregulationblog.blogspot.com/2015/09/interest-rate-policy-dependent-on-what_13.html
08/23/15 http://cmpassocregulationblog.blogspot.com/2015/08/global-decline-of-values-of-financial.html
6/14/15 http://cmpassocregulationblog.blogspot.com/2015/06/volatility-of-financial-asset.html
5/24/15 http://cmpassocregulationblog.blogspot.com/2015/05/interest-rate-policy-and-dollar.html
4/26/2015 http://cmpassocregulationblog.blogspot.com/2015/04/imf-view-of-economy-and-finance-united.html
4/19/2015 http://cmpassocregulationblog.blogspot.com/2015/04/global-portfolio-reallocations-squeeze.html
3/29/15 http://cmpassocregulationblog.blogspot.com/2015/03/dollar-revaluation-and-financial-risk.html
3/15/15 http://cmpassocregulationblog.blogspot.com/2015/03/global-exchange-rate-struggle-recovery.html
2/22/15 http://cmpassocregulationblog.blogspot.com/2015/02/world-financial-turbulence-squeeze-of.html
12/14/14 http://cmpassocregulationblog.blogspot.com/2014/12/global-financial-and-economic-risk.html
11/23/14 http://cmpassocregulationblog.blogspot.com/2014/11/squeeze-of-economic-activity-by-carry.htm
9/14/14 http://cmpassocregulationblog.blogspot.com/2014/09/geopolitics-monetary-policy-and.html
8/17/2014 http://cmpassocregulationblog.blogspot.com/2014/08/weakening-world-economic-growth.html
6/15/2014 http://cmpassocregulationblog.blogspot.com/2014/06/financialgeopolitical-risks-recovery.html
5/18/14 http://cmpassocregulationblog.blogspot.com/2014/05/world-inflation-waves-squeeze-of.html
3/16/2014 http://cmpassocregulationblog.blogspot.com/2014/03/global-financial-risks-recovery-without.html
2/23/14 http://cmpassocregulationblog.blogspot.com/2014/02/squeeze-of-economic-activity-by-carry.html
12/15/13 http://cmpassocregulationblog.blogspot.com/2013/12/theory-and-reality-of-secular.html
11/17/13 http://cmpassocregulationblog.blogspot.com/2013/11/risks-of-unwinding-monetary-policy.html
9/15/13 http://cmpassocregulationblog.blogspot.com/2013/09/recovery-without-hiring-ten-million.html
8/18/13 http://cmpassocregulationblog.blogspot.com/2013/08/duration-dumping-and-peaking-valuations.html
Japan’s economy grew 1.0 percent in IQ2014, seasonally adjusted, partly because of anticipation of purchases to avoid the increase in the tax on value added of consumption in Apr 2014, contracting 1.9 percent in IIQ2014, as shown in Table VB-1, incorporating the latest estimates and revisions. Japan’s GDP changed 0.1 percent in IIIQ2014 and grew 0.5 percent in IVQ2014. The GDP of Japan increased 1.4 percent in IQ2015 and increased 0.1
percent in IIQ2015. The GDP of Japan decreased 0.1 percent in IIIQ2015. Japan’s GDP contracted 0.4 percent in IVQ2015. The GDP of Japan increased 0.5 percent in IQ2016 and increased 0.1 percent in IIQ2016. Japan’s GDP increased 0.2 percent in IIIQ2016. The GDP of Japan increased 0.3 percent in IVQ2016, increasing 1.2 percent in IQ2017. Japan’s GDP increased 0.4 percent in IIQ2017 and increased 0.6 percent in IIIQ2017. The GDP of Japan increased 0.5 percent in IVQ2017. Japan’s GDP contracted 0.5 percent in IQ2018 and increased 0.4 percent in IIQ2018. Japan’s GDP contracted 0.8 percent in IIIQ2018. Japan’s GDP increased 0.6 percent in IVQ2018. Japan’s GDP increased 0.6 percent in IQ2019 and increased 0.5 percent in IIQ2019. Japan’s GDP changed 0.0 percent in IIIQ2019. Japan’s GDP contracted 1.9
percent in IVQ2019 and contracted 0.6 percent in IQ2020. The GDP of Japan changed 0.0 percent in IVQ2013 after growing 0.8 percent in IIIQ2013, 0.8 percent in IIQ2013 and 1.2 percent in IQ2013. Japan’s GDP increased 0.3 percent in IVQ2012 relative to IIIQ2012. GDP growth in IQ2012 was revised to 1.2 percent; IIQ2012 GDP growth was revised to minus 0.7 percent; and IIIQ2012 growth was revised to minus 0.4 percent. The economy of Japan had already weakened in IVQ2010 when GDP fell revised 0.8 percent. As in other advanced economies, Japan’s recovery from the global recession has not been robust. GDP fell 1.4 percent in IQ2011 and fell again 0.7 percent in IIQ2011 because of the disruption of the tragic Tōhoku or Great East Earthquake and Tsunami of Mar 11, 2011. Recovery was robust in the first two quarters of 2010 but GDP grew at 1.8 percent in IIIQ2010 and fell 0.8 percent in IVQ2010. The deepest quarterly contractions in the global recession were 2.4 percent in IVQ2008 and 4.8 percent in IQ2009. There is classic research on analyzing deviations of output from trend (see for example Schumpeter 1939, Hicks 1950, Lucas 1975, Sargent and Sims 1977). Using seasonally adjusted and price adjusted data (https://www.cao.go.jp/index-e.html), Japan’s GDP fell 8.6 percent from the pre-downturn peak of ¥506,845.7 million in IQ2008 to the lowest reading of ¥463,269.9 million in IQ2009. Japan’s GDP increased 3.9 percent from the pre-downturn peak of ¥506,845.7 million in IQ2008 to ¥526,425.8 million in IQ2020 at the annual equivalent rate of 0.3 percent. GDP in Japan grew 13.6 percent from IIQ2009 to IQ2020 at the annual equivalent rate of 1.2 percent, using the latest revision (https://www.cao.go.jp/index-e.html). The Economic and Social Research Institute (ESRI) of the Cabinet Office of Japan revised the national accounts of Japan following the international standard of the national accounts. ESRI also changed the benchmark reference year from 2005 to 2011 (http://www.esri.cao.go.jp/en/sna/data/kakuhou/files/2015/pdf/20160930_2008sna.pdf http://www.esri.cao.go.jp/en/sna/data/sokuhou/files/2016/qe163_2/pdf/note_e.pdf). ESRI revised GDP since 1994 (http://www.esri.cao.go.jp/en/sna/data/sokuhou/files/2017/qe173_2/gdemenuea.html http://www.esri.cao.go.jp/en/sna/data/sokuhou/files/2017/qe173_2/pdf/note_e.pdf).
Table VB-1, Japan, Real GDP ∆% Changes from the Previous Quarter Seasonally Adjusted ∆%
IQ | IIQ | IIIQ | IVQ | |
2020 | -0.6 | |||
2019 | 0.6 | 0.5 | 0.0 | -1.9 |
2018 | -0.5 | 0.4 | -0.8 | 0.6 |
2017 | 1.2 | 0.4 | 0.6 | 0.5 |
2016 | 0.5 | 0.1 | 0.2 | 0.3 |
2015 | 1.4 | 0.1 | -0.1 | -0.4 |
2014 | 1.0 | -1.9 | 0.1 | 0.5 |
2013 | 1.2 | 0.8 | 0.8 | 0.0 |
2012 | 1.2 | -0.7 | -0.4 | 0.3 |
2011 | -1.4 | -0.7 | 2.5 | -0.2 |
2010 | 0.9 | 1.4 | 1.8 | -0.8 |
2009 | -4.8 | 2.1 | 0.1 | 1.4 |
2008 | 0.3 | -0.4 | -1.2 | -2.4 |
2007 | 0.7 | 0.1 | -0.5 | 0.5 |
2006 | 0.2 | 0.2 | -0.2 | 1.3 |
2005 | 0.5 | 0.7 | 1.0 | 0.2 |
2004 | 0.7 | 0.0 | 0.6 | -0.2 |
2003 | 0.1 | 0.6 | 0.4 | 1.1 |
2002 | 0.2 | 0.7 | 0.3 | 0.3 |
2001 | 0.5 | -0.5 | -1.0 | -0.3 |
2000 | 1.8 | 0.3 | 0.1 | 1.0 |
1999 | -1.3 | 0.3 | 0.6 | 0.1 |
1998 | -1.1 | -0.4 | 0.2 | 0.8 |
1997 | 0.3 | -0.7 | 0.2 | 0.0 |
Source: Japan Economic and Social Research Institute, Cabinet Office
https://www.cao.go.jp/index-e.html
http://wwwa.cao.go.jp/notice/20191101notice.html
Japan’s GDP contracted at 2.2 percent in IQ2020 with deductions of 1.7 percent by personal consumption expenditures (PC), 0.8 percent by Net trade (Trade) and 0.4 percent by private inventory investment (PINV). Government expenditure (GOVC) contributed 0.0 percent and Gross Fixed Capital Formation (GFCF) added 0.6 percent. Japan’s GDP contracted at 7.2 percent in IVQ2019 with contributions of 2.1 percent by Net trade (Trade), 0.2 percent by government expenditure (GOVC) and 0.0 percent by private inventory investment (PINV). Personal consumption expenditures (PC) deducted 6.3 percent and Gross Fixed Capital Formation (GFCF subtracted 3.3 percent. Japan’s GDP grew at 0.0 percent in IIIIQ2019 with contributions of 0.5 percent by Gross Fixed Capital Formation (GFCF) and 0.6 percent by government expenditure (GOVC). Net trade (Trade) deducted 1.0 percent and private inventory investment (PINV) subtracted 1.0 percent. Personal consumption expenditures (PC) contributed 1.0 percent. The GDP of Japan grew at 2.1 percent in IIQ2019 with contributions of 0.9 percent by Gross Fixed Capital Formation (GFCF) and 1.2 percent by Personal consumption expenditures (PCE). Government expenditure (GOVC) contributed 1.2 percent. Net trade deducted 1.2 percent and private inventory investment (PINV) subtracted 0.0 percent.
Japan’s GDP grew at 2.6 percent in IQ2019 with contributions of 0.3 percent by Gross Fixed Capital Formation (GFCF) and 2.1 percent by net trade (Trade). Government expenditure (GOVC) deducted 0.1 percent and private inventory investment (PINV) added 0.2 percent. Personal consumption expenditures (PC) contributed 0.1 percent. Japan’s GDP grew at 2.3 percent in IVQ2018 with contributions of 0.5 percent by government expenditures (GOVC) and 0.9 percent by personal consumption expenditures (PC). Gross Fixed Capital Formation (GFCF) contributed 2.8 percent and private inventory investment (PINV) added 0.1 percent. Net Trade deducted 2.0 percentage points. The GDP of Japan contracted at minus 3.3 percent in IIIQ2018 with contribution of 0.1 percent by government expenditures (GOVC). Personal consumption (PC) deducted 0.5 percentage points and gross fixed capital formation (GFCF) deducted 3.2 percentage points. Net trade (Trade) deducted 0.7 percentage points and inventory investment (PINV) contributed 1.0 percentage points. The GDP of Japan grew at 1.8 percent in IIQ2018 with contributions of 0.5 percent by personal consumption (PC) and 1.5 percent by gross fixed capital formation (GFCF). Net trade (Trade) contributed 0.0 percentage points, inventory investment (PINV) deducted 0.3 percentage points and government expenditures (GOVC) contributed 0.0 percentage points. Japan’s GDP contracted at 1.9 percent in IQ2018 with contributions of 0.3 percent by Net Trade (Trade), 0.4 percent by government expenditures (GOVC) and minus 0.8 percent by personal consumption expenditures (PC). Gross Fixed Capital Formation (GFCF) deducted 0.2 percent and private inventory divestment (PINV) deducted 1.5 percent. The GDP of Japan grew at 1.9 percent in IVQ2017 with contributions of 1.1 percent by personal consumption (PC) and 0.6 percent by gross fixed capital formation (GFCF). Net trade (Trade) deducted 0.3 percentage points, inventory investment (PINV) contributed 0.4 percentage points and government expenditures (GOVC) contributed 0.1 percentage points. Japan’s GDP grew at 2.2 percent in IIIQ2017 with Net Trade (Trade) contributing 2.1 percentage points and inventory investment (PINV) adding 1.9 percentage points. Private consumption (PC) deducted 1.4 percentage points. Gross Fixed Capital Formation (GFCF) deducted 0.4 percentage points and government consumption (GOVC) contributed 0.2 percentage points. The GDP of Japan grew at 1.4 percent in IIQ2017 with contributions of 1.5 percent by personal consumption (PC), 1.3 percent by gross fixed capital formation (GFCF) and minus 0.3 percent by government expenditures (GOV). Net trade (Trade) deducted 0.9 percentage points and inventory divestment (PINV) subtracted 0.4 percentage points. The GDP of Japan grew at 4.7 percent in IQ2017 with contributions of 1.3 percent of gross fixed capital formation (GFCF), 0.4 percent of net exports (Trade) and 0.3 percent of government consumption (GOVC). Inventory investment (PINV) contributed 0.9 percent and personal consumption (PC) contributed 1.9 percent. The GDP of Japan grew at 1.2 percent in IVQ2016 with contributions of 0.7 percent of gross fixed capital formation (GFCF), 1.5 percent of net exports (Trade) and deduction of 0.1 percent of government consumption (GOVC). Inventory divestment (PINV) deducted 0.9 percent and personal consumption (PC) contributed 0.1 percent. Japan’s GDP grew at 0.9 percent in IIIQ2016 with contributions of 1.2 percent of personal consumption expenditures (PC), 1.2 percent of net trade (Trade) and 0.2 percent of government consumption expenditures (GOVC). Inventory divestment (PINV) deducted 1.9 percent and gross capital formation (GFCF) contributed 0.1 percent. The GDP of Japan grew at 0.6 percent in IIQ2016 with deduction of 1.2 percent by personal consumption expenditures. Gross fixed capital formation (GFCF) contributed 0.2 percent and government consumption expenditures (GOVC) deducted 0.7 percent. Net trade (Trade) added 0.5 percent and change of private inventories (PINV) added 1.8 percent. Japan’s GDP grew at 2.0 percent in IQ2016 with contributions of 0.3 percent by personal consumption, 1.4 percent by trade and 0.9 percent by government. Gross fixed capital formation deducted 0.4 percent. The GDP of Japan grew at minus 1.5 percent in IVQ2015 with deduction of 1.5 percent by personal consumption (PC) expenditures and deduction of 0.4 percent by private inventories (PINV). Net trade contributed 0.1 percent and gross fixed capital formation deducted 0.4 percent. GDP grew at minus 0.2 percent in IIIQ2015 with contributions of 0.9 percent by personal consumption expenditures and 0.3 percentage points by government consumption. Net trade deducted 0.6 percent. Gross Fixed Capital Formation contributed 0.4 percentage points and inventory divestment deducted 1.1 percentage points. GDP grew at 0.4 percent in IIQ2015 with contribution of 0.0 percent by personal consumption expenditures and deduction of 0.5 percent of net exports. Goss fixed capital formation deducted 0.9 percentage points; government consumption expenditures contributed 0.0 percentage points; and inventory investment added 1.9 percentage points. GDP grew at 5.6 percent in IQ2015 with contributions of 1.2 percentage points by personal consumption expenditures, 2.3 percent by gross fixed capital formation and increase in inventory investment at 1.1 percent. Government expenditures increased at 0.7 percent while trade contributed 0.2 percentage points. GDP expanded at 2.0 percent in IVQ2014 with contribution of 0.6 percent by personal consumption expenditures, 1.5 percent by net trade and 0.2 percent by government consumption expenditures. Gross fixed capital formation added 0.9 percent and private inventory divestment deducted 1.0 percent. Japan grew at 0.4 percent in IIIQ2014 with contributions of 0.2 percentage points of GFCF and 1.7 percentage points by personal consumptions expenditure but deduction of 1.7 percentage points of inventory divestment. Traded deducted 0.3 percentage points and government added 0.4 percent. Japan’s GDP contracted at 7.5 percent in IIQ2014 with deductions of 11.4 percent by personal consumption and 3.5 percent by gross fixed capital formation. Trade added 4.0 percentage points and government expenditures deducted 0.4 percent. Inventory investment added 3.9 percent. The GDP of Japan expanded at 4.0 percent in IQ2014 with contributions of 4.7 percent by personal consumption and 1.6 percent of gross fixed capital formation. There were deductions of 0.7 percent by trade and 1.8 percent by inventory divestment. Government expenditures contributed 0.2 percent. The GDP of Japan decreased at 0.1 percent annual equivalent in IVQ2013 with deduction of personal consumption expenditures of 0.2 percent and growth of GFCF at 1.8 percent. Trade deducted 2.2 percentage points. Japan grew at 3.4 percent in IIIQ2013 with contribution of 1.0 percentage points by personal consumption and 2.7 percentage points by GFCF. Trade deducted 1.3 percentage points. Japan grew at 3.1 percent SAAR in IIQ2013 driven by contribution of 1.9 percent of personal consumption, deduction of 0.1 percent of net trade and contribution of gross fixed capital formation at 2.7 percent. In IQ2013, Japan’s GDP increased at the SAAR of 5.0 percent in large part because of 3.1 percent in personal consumption and 1.5 percent in trade. The SAAR of GDP in IVQ2012 was 1.1 percent: 1.1 percentage points from growth of personal consumption expenditures less 0.4 percentage points of net trade (exports less imports) less 0.2 percentage points of private inventory investment (PINV) plus 0.5 percentage points of government consumption and 0.1 percentage points of gross fixed capital formation. The SAAR of GDP in IIIQ2011 was revised to a high 10.3 percent. Net trade deducted from GDP growth in three quarters of 2011 and provided the growth impulse of 3.6 percentage points in IIIQ2011. Growth in 2011 and IQ2012 was driven by personal consumption expenditures that deducted 0.3 percentage points from GDP growth in IIIQ2012 but contributed 1.1 percentage points to GDP growth in IVQ2012.
Table VB-2, Japan, Contributions to Changes in Real GDP, Seasonally Adjusted Annual Rates (SAAR), %
GDP | PC | GFCF | Trade | PINV | GOVC | |
2020 | ||||||
I | -2.2 | -1.7 | 0.6 | -0.8 | -0.4 | 0.0 |
2019 | ||||||
I | 2.6 | 0.1 | 0.3 | 2.1 | 0.2 | -0.1 |
II | 2.1 | 1.2 | 0.9 | -1.2 | 0.0 | 1.2 |
III | 0.0 | 1.0 | 0.5 | -1.0 | -1.0 | 0.6 |
IV | -7.2 | -6.3 | -3.3 | 2.1 | 0.0 | 0.2 |
2018 | ||||||
I | -1.9 | -0.8 | -0.2 | 0.3 | -1.5 | 0.4 |
II | 1.8 | 0.5 | 1.5 | 0.0 | -0.3 | 0.0 |
III | -3.3 | -0.5 | -3.2 | -0.7 | 1.0 | 0.1 |
IV | 2.3 | 0.9 | 2.8 | -2.0 | 0.1 | 0.5 |
2017 | ||||||
I | 4.7 | 1.9 | 1.3 | 0.4 | 0.9 | 0.3 |
II | 1.4 | 1.5 | 1.3 | -0.9 | -0.4 | -0.3 |
III | 2.2 | -1.4 | -0.4 | 2.1 | 1.9 | 0.2 |
IV | 1.9 | 1.1 | 0.6 | -0.3 | 0.4 | 0.1 |
2016 | ||||||
I | 2.0 | 0.3 | -0.4 | 1.4 | -0.3 | 0.9 |
II | 0.6 | -1.2 | 0.2 | 0.5 | 1.8 | -0.7 |
III | 0.9 | 1.2 | 0.1 | 1.2 | -1.9 | 0.2 |
IV | 1.2 | 0.1 | 0.7 | 1.5 | -0.9 | -0.1 |
2015 | ||||||
I | 5.6 | 1.2 | 2.3 | 0.2 | 1.1 | 0.7 |
II | 0.4 | 0.0 | -0.9 | -0.5 | 1.9 | 0.0 |
III | -0.2 | 0.9 | 0.4 | -0.6 | -1.1 | 0.3 |
IV | -1.5 | -1.5 | -0.4 | 0.1 | -0.4 | 0.7 |
2014 | ||||||
I | 4.0 | 4.7 | 1.6 | -0.7 | -1.8 | 0.2 |
II | -7.5 | -11.4 | -3.5 | 4.0 | 3.9 | -0.4 |
III | 0.4 | 1.7 | 0.2 | -0.3 | -1.7 | 0.4 |
IV | 2.0 | 0.6 | 0.9 | 1.5 | -1.0 | 0.2 |
2013 | ||||||
I | 5.0 | 3.1 | 0.7 | 1.5 | -0.1 | 0.0 |
II | 3.1 | 1.9 | 2.7 | -0.1 | -2.4 | 1.0 |
III | 3.4 | 1.0 | 2.7 | -1.3 | 1.0 | 0.0 |
IV | -0.1 | -0.2 | 1.8 | -2.2 | 0.4 | 0.1 |
2012 | ||||||
I | 4.9 | 1.0 | 0.9 | 0.8 | 1.2 | 0.9 |
II | -2.9 | 0.4 | 0.6 | -2.0 | -1.8 | -0.3 |
III | -1.5 | -0.3 | -0.6 | -1.9 | 1.0 | 0.3 |
IV | 1.1 | 1.1 | 0.1 | -0.4 | -0.2 | 0.5 |
2011 | ||||||
I | -5.5 | -4.2 | 0.6 | -1.3 | -1.1 | 0.4 |
II | -2.6 | 2.1 | -0.5 | -4.3 | -0.2 | 0.3 |
III | 10.3 | 3.7 | 1.5 | 3.6 | 1.1 | 0.3 |
IV | -0.6 | 1.2 | 1.7 | -2.8 | -0.8 | 0.2 |
2010 | ||||||
I | 3.5 | 0.3 | 0.6 | 2.0 | 1.3 | -0.8 |
II | 5.5 | 2.3 | -0.2 | 0.3 | 2.0 | 1.2 |
III | 7.4 | 3.2 | 0.7 | 0.7 | 2.6 | 0.3 |
IV | -3.2 | -3.1 | -0.3 | -0.2 | 0.0 | 0.3 |
2009 | ||||||
I | -17.8 | -1.0 | -4.3 | -4.7 | -8.3 | 0.2 |
II | 8.6 | 2.6 | -1.7 | 7.5 | -1.1 | 1.1 |
III | 0.2 | 1.6 | -2.7 | 2.2 | -1.8 | 0.9 |
IV | 5.6 | 1.7 | -0.6 | 2.8 | 1.3 | 0.4 |
2008 | ||||||
I | 1.0 | 0.9 | 0.5 | 0.8 | -1.3 | 0.1 |
II | -1.5 | -2.2 | -1.1 | 0.4 | 2.4 | -0.9 |
III | -4.9 | -0.7 | -0.6 | -0.1 | -3.5 | 0.0 |
IV | -9.4 | -3.3 | -2.4 | -10.4 | 6.3 | 0.3 |
2007 | ||||||
I | 3.0 | 0.4 | -0.2 | 1.1 | 1.3 | 0.4 |
II | 0.5 | 1.4 | -1.4 | 0.7 | -1.0 | 0.5 |
III | -2.0 | -2.1 | -2.4 | 2.3 | 0.5 | -0.1 |
IV | 1.9 | 0.5 | -1.3 | 1.2 | 1.0 | 0.5 |
Note: PC: Private Consumption; GFCF: Gross Fixed Capital Formation; PINV: Private Inventory; Trade: Net Exports; GOVC: Government Consumption
Source: Japan Economic and Social Research Institute, Cabinet Office
https://www.cao.go.jp/index-e.html
http://wwwa.cao.go.jp/notice/20191101notice.html
Long-term economic growth in Japan significantly improved by increasing competitiveness in world markets. Net trade of exports and imports is an important component of the GDP accounts of Japan. Table VB-3 provides quarterly data for net trade, exports and imports of Japan. Net trade had strong positive contributions to GDP growth in Japan in all quarters from IQ2007 to IIQ2009 with exception of IVQ2008, IIIQ2008 and IQ2009. The US recession is dated by the National Bureau of Economic Research (NBER) as beginning in IVQ2007 (Dec) and ending in IIQ2009 (Jun) (https://www.nber.org/cycles.html). Net trade contributions helped to cushion the economy of Japan from the global recession. Net trade deducted from GDP growth in six of the nine quarters from IVQ2010 to IQ2012. The only strong contribution of net trade was 3.6 percent in IIIQ2011. Net trade added 0.8 percent in IQ2012, deducting 2.0 percent in IIQ2012. Net trade deducted 1.9 percent in IIIQ2012. Net traded deducted 0.4 percent in IVQ2012. Net trade added 1.5 percentage points to GDP growth in IQ2013 but deducted 0.1 percentage points in IIQ2013, deducting 1.3 percentage points in IIIQ2013 and 2.2 percentage points in IVQ2013. Net trade deducted 0.7 percentage points from GDP growth in IQ2014. Net trade added 4.0 percentage points to GDP growth in IIQ2014 and deducted 0.3 percentage points in IIIQ2014. Net trade added 1.5 percentage points to GDP growth in IVQ2014. Net trade contributed 0.2 percentage points to GDP growth in IQ2015 and deducted 0.5-percentage points in IIQ2015. Net trade deducted 0.6 percentage points from GDP growth in IIIQ2015. Net trade contributed 0.1 percentage points to GDP growth in IVQ2015 and added 1.4 percentage points in IQ2016. Net trade contributed 0.5 percentage points to GDP growth in IIQ2016. Net trade added 1.2 percentage points to GDP growth in IIIQ2016 and contributed 1.5 percentage points in IVQ2016. Net trade contributed 0.4 percentage points to GDP growth in IQ2017 and deducted 0.9 percentage points in IIQ2017. Net trade contributed 2.1 percentage points to GDP growth in IIIQ2017 and deducted 0.3 percentage-point in IVQ2017. Net trade contributed 0.3 percentage points to GDP growth in IQ2018 and contributed 0.0 percentage points in IIQ2018. Net trade deducted 0.7 percentage points from GDP growth in IIIQ2018 and deducted 2.0 percentage points in IVQ2018. Net trade contributed 2.1 percentage points to GDP growth in IQ2019 with export contraction deducting 1.3 percent and import contraction contributing 3.4 percent. Net trade deducted 1.2 percentage points from GDP growth in IIQ2019. Net trade deducted 1.0 percentage points from GDP growth in IIIQ2019. Net trade contributed 2.1 percentage points to GDP growth in IVQ2019 mostly by 1.8 percentage points of import contraction. Net trade deducted 0.8 percentage points from GDP growth in IQ2020 with exports deducting 4.3 percent and import contraction adding 3.4 percentage points. Private consumption assumed the role of driver of Japan’s economic growth but should moderate as in most mature economies.
Table VB-3, Japan, Contributions to Changes in Real GDP, Seasonally Adjusted Annual Rates (SAAR), %
Net Trade | Exports | Imports | |
2020 | |||
I | -0.8 | -4.3 | 3.4 |
2019 | |||
I | 2.1 | -1.3 | 3.4 |
II | -1.2 | 0.1 | -1.3 |
III | -1.0 | -0.4 | -0.5 |
IV | 2.1 | 0.3 | 1.8 |
2018 | |||
I | 0.3 | 0.7 | -0.5 |
II | 0.0 | 0.6 | -0.6 |
III | -0.7 | -1.7 | 1.0 |
IV | -2.0 | 1.2 | -3.2 |
2017 | |||
I | 0.4 | 1.5 | -1.1 |
II | -0.9 | 0.0 | -0.9 |
III | 2.1 | 1.4 | 0.7 |
IV | -0.3 | 1.4 | -1.7 |
2016 | |||
I | 1.4 | 0.5 | 0.9 |
II | 0.5 | -0.4 | 0.9 |
III | 1.2 | 1.5 | -0.3 |
IV | 1.5 | 1.9 | -0.5 |
2015 | |||
I | 0.2 | 0.9 | -0.8 |
II | -0.5 | -2.5 | 1.9 |
III | -0.6 | 1.7 | -2.3 |
IV | 0.1 | -0.6 | 0.7 |
2014 | |||
I | -0.7 | 3.9 | -4.6 |
II | 4.0 | 0.8 | 3.1 |
III | -0.3 | 1.1 | -1.3 |
IV | 1.5 | 2.1 | -0.6 |
2013 | |||
I | 1.5 | 1.8 | -0.3 |
II | -0.1 | 1.9 | -2.1 |
III | -1.3 | 0.0 | -1.3 |
IV | -2.2 | -0.3 | -2.0 |
2012 | |||
I | 0.8 | 1.9 | -1.1 |
II | -2.0 | -0.6 | -1.4 |
III | -1.9 | -2.2 | 0.2 |
IV | -0.4 | -2.0 | 1.6 |
2011 | |||
I | -1.3 | -0.5 | -0.8 |
II | -4.3 | -4.6 | 0.4 |
III | 3.6 | 5.5 | -1.8 |
IV | -2.8 | -1.7 | -1.1 |
2010 | |||
I | 2.0 | 3.3 | -1.3 |
II | 0.3 | 2.8 | -2.5 |
III | 0.7 | 1.7 | -1.0 |
IV | -0.2 | 0.2 | -0.3 |
2009 | |||
I | -4.7 | -16.2 | 11.5 |
II | 7.5 | 4.6 | 2.9 |
III | 2.2 | 5.3 | -3.1 |
IV | 2.8 | 4.2 | -1.4 |
2008 | |||
I | 0.8 | 1.8 | -0.9 |
II | 0.4 | -1.5 | 1.9 |
III | -0.1 | 0.1 | -0.2 |
IV | -10.4 | -9.2 | -1.1 |
2007 | |||
I | 1.1 | 1.6 | -0.5 |
II | 0.7 | 1.5 | -0.8 |
III | 2.3 | 1.7 | 0.5 |
IV | 1.2 | 2.0 | -0.8 |
Source: Japan Economic and Social Research Institute, Cabinet Office
https://www.cao.go.jp/index-e.html
http://wwwa.cao.go.jp/notice/20191101notice.html
Japan’s percentage growth of GDP not seasonally adjusted in a quarter relative to the same quarter a year earlier is in in Table VB-4. Contraction of GDP in a quarter relative to the same quarter a year earlier extended over seven quarters from IIQ2008 through IVQ2009. Contraction was sharpest in IQ2009 with output declining 8.8 percent relative to a year earlier. Yearly quarterly rates of growth of Japan were relatively high for a mature economy through the decade except for the contractions from IVQ2001 to IIQ2002 and after 2007. The Tōhoku or Great East Earthquake and Tsunami of Mar 11, 2011 caused slower GDP in IQ2011 at 0.8 percent relative to the same quarter a year earlier and decline of 1.0 percent in IIQ2011. GDP fell 0.4 percent in IIIQ2011 relative to a year earlier and increased 0.1 percent in IVQ2011 relative to a year earlier. Growth resumed with 3.1 percent in IQ2012 relative to a year earlier. Growth of 2.9 percent in IIQ2012 is largely caused by the low level in IIQ2011 resulting from the Tōhoku or Great East Earthquake and Tsunami of Mar 11, 2011. GDP decreased 0.1 percent in IIIQ2012 relative to a year earlier and increased 0.3 percent in IVQ2012 relative to a year earlier. GDP increased 0.4 percent in IQ2013 relative to a year earlier and 1.9 percent in IIQ2013. Growth of 3.0 percent in IIIQ2013 relative to a year earlier is partly due to the decline of 0.4 percent in GDP in IIIQ2012. GDP increased 2.7 percent in IVQ2013 relative to a year earlier. The GDP of Japan increased 3.0 percent in IQ2014 relative to a year earlier. Japan’s GDP contracted 0.1 percent in IIQ2014 relative to a year earlier. GDP contracted 0.9 percent in IIIQ2014 relative to a year earlier. Japan’s GDP contracted 0.5 percent in IVQ2014 relative to a year earlier. GDP changed 0.0 percent relative to a year earlier in IQ2015 and increased 2.2 percent in IIQ2015 relative to a year earlier. GDP increased 1.9 percent in IIIQ2015 relative to a year earlier. GDP increased 0.9 percent in IVQ2015 relative to a year earlier. GDP increased 0.2 percent in IQ2016 relative to a year earlier. GDP increased 0.2 percent in IIQ2016 relative to a year earlier. The GDP of Japan increased 0.5 percent in IIIQ2016 relative to a year earlier. In IVQ2016, Japan’s GDP increased 1.2 percent relative to a year earlier. Japan’s GDP increased 1.8 percent in IQ2017 relative to a year earlier. In IIQ2017, Japan’s GDP increased 1.9 percent relative to a year earlier. The GDP of Japan increased 2.4 percent in IIIQ2017 relative to a year earlier. Japan’s GDP increased 2.5 percent in IVQ2017 relative to a year earlier. In IQ2018, the GDP of Japan increased 0.9 percent relative to a year earlier. Japan’s GDP increased 1.0 percent in IIQ2018 relative to a year earlier and decreased 0.3 percent in IIIQ2018 relative to a year earlier. The GDP of Japan decreased 0.4 percent in IVQ2018 relative to a year earlier, increasing 0.8 percent in IQ2019 relative to a year earlier. Japan’s GDP increased 0.9 percent in IIQ2019 relative to a year earlier. The GDP of Japan increased 1.7 percent in IIIQ2019 relative to a year earlier. Japan’s GDP fell 0.7 percent in IVQ2019 relative to a year earlier. The GDP of Japan decreased 1.7 percent in IQ2020 relative to a year earlier. Japan faces the challenge of recovery from the devastation of the Tōhoku or Great East Earthquake and Tsunami of Mar 11, 2011 in an environment of declining world trade and bouts of risk aversion that cause appreciation of the Japanese yen, eroding the country’s competitiveness in world markets. There is classic research on analyzing deviations of output from trend (see for example Schumpeter 1939, Hicks 1950, Lucas 1975, Sargent and Sims 1977). Using price adjusted but not seasonally adjusted data (https://www.cao.go.jp/index-e.html), Japan’s GDP contracted 11.4 percent from the high in IVQ2007 to the low in IIQ2009. GDP increased 2.4 percent from IVQ2007 to IQ2020 at the annual equivalent rate of 0.2 percent. Japan’s GDP grew 15.6 percent from IIIQ2009 to IQ2020 at the annual equivalent rate of 1.4 percent.
Table VB-4, Japan, Real GDP ∆% Changes from Same Quarter Year Earlier, NSA ∆%
IQ | IIQ | IIIQ | IVQ | |
2020 | -1.7 | |||
2019 | 0.8 | 0.9 | 1.7 | -0.7 |
2018 | 0.9 | 1.0 | -0.3 | -0.4 |
2017 | 1.8 | 1.9 | 2.4 | 2.5 |
2016 | 0.2 | 0.2 | 0.5 | 1.2 |
2015 | 0.0 | 2.2 | 1.9 | 0.9 |
2014 | 3.0 | -0.1 | -0.9 | -0.5 |
2013 | 0.4 | 1.9 | 3.0 | 2.7 |
2012 | 3.1 | 2.9 | -0.1 | 0.3 |
2011 | 0.8 | -1.0 | -0.4 | 0.1 |
2010 | 4.5 | 3.7 | 5.7 | 3.0 |
2009 | -8.8 | -6.4 | -5.1 | -1.3 |
2008 | 0.5 | -0.2 | -0.9 | -3.7 |
2007 | 2.3 | 1.9 | 1.6 | 0.9 |
2006 | 2.4 | 1.4 | 0.3 | 1.6 |
2005 | 1.1 | 1.5 | 1.8 | 2.2 |
2004 | 3.2 | 2.2 | 2.4 | 1.0 |
2003 | 1.5 | 1.4 | 1.3 | 1.9 |
2002 | -1.6 | -0.2 | 0.9 | 1.3 |
2001 | 2.2 | 1.2 | -0.1 | -1.5 |
2000 | 3.3 | 2.8 | 2.4 | 2.6 |
1999 | -0.5 | -0.1 | 0.3 | -0.7 |
1998 | -1.5 | -1.0 | -1.3 | -0.7 |
1997 | 2.8 | 1.0 | 1.0 | -0.3 |
Source: Japan Economic and Social Research Institute, Cabinet Office
https://www.cao.go.jp/index-e.html
http://wwwa.cao.go.jp/notice/20191101notice.html
VC China. China estimates an index of nonmanufacturing purchasing managers based on a sample of 1200 nonmanufacturing enterprises across the country (http://www.stats.gov.cn/english/pressrelease/t20121009_402841094.htm). Table CIPMNM provides this index and components. The total index increased from 55.7 in Jan 2011 to 58.0 in Mar 2012, decreasing to 53.9 in Aug 2013. The index decreased from 56.0 in Nov 2013 to 54.6 in Dec 2013, easing to 53.4 in Jan 2014. The index moved to 53.6 in May 2020. The index of new orders increased from 52.2 in Jan 2012 to 54.3 in Dec 2012 but fell to 50.1 in May 2013, barely above the neutral frontier of 50.0. The index of new orders stabilized at 51.0 in Nov-Dec 2013, easing to 50.9 in Jan 2014. The index of new orders moved to 52.6 in May 2020.
Table CIPMNM, China, Nonmanufacturing Index of Purchasing Managers, %, Seasonally Adjusted
Total Index | New Orders | Interm. | Subs Prices | Exp | |
May 2020 | 53.6 | 52.6 | 52.0 | 48.6 | 63.9 |
Apr | 53.2 | 52.1 | 49.0 | 45.4 | 60.1 |
Mar | 52.3 | 49.2 | 49.4 | 46.1 | 57.3 |
Feb | 29.6 | 26.5 | 49.3 | 43.9 | 40.0 |
Jan | 54.1 | 50.6 | 53.3 | 50.5 | 59.6 |
Dec 2019 | 53.5 | 50.4 | 52.4 | 50.3 | 59.1 |
Nov | 54.4 | 51.3 | 53.2 | 51.3 | 61.0 |
Oct | 52.8 | 49.4 | 51.3 | 48.9 | 60.7 |
Sep | 53.7 | 50.5 | 52.8 | 50.0 | 59.7 |
Aug | 53.8 | 50.1 | 50.8 | 49.1 | 60.4 |
Jul | 53.7 | 50.4 | 52.9 | 50.6 | 59.8 |
Jun | 54.2 | 51.5 | 51.5 | 49.7 | 60.6 |
May | 54.3 | 50.3 | 52.2 | 49.9 | 60.2 |
Apr | 54.3 | 50.8 | 53.0 | 50.5 | 60.3 |
Mar | 54.8 | 52.5 | 52.5 | 51.0 | 61.1 |
Feb | 54.3 | 50.7 | 52.7 | 50.1 | 61.5 |
Jan | 54.7 | 51.0 | 52.0 | 49.8 | 59.6 |
Dec 2018 | 53.8 | 50.4 | 50.1 | 47.6 | 60.8 |
Nov | 53.4 | 50.1 | 50.8 | 49.4 | 60.9 |
Oct | 53.9 | 50.1 | 54.9 | 51.2 | 60.6 |
Sep | 54.9 | 51.0 | 55.6 | 51.5 | 60.1 |
Aug | 54.2 | 50.6 | 54.3 | 50.9 | 61.4 |
Jul | 54.0 | 51.0 | 53.9 | 52.0 | 60.2 |
Jun | 55.0 | 50.6 | 53.5 | 51.1 | 60.8 |
May | 54.9 | 51.0 | 54.2 | 50.6 | 61.0 |
Apr | 54.8 | 51.1 | 52.7 | 50.6 | 61.5 |
Mar | 54.6 | 50.1 | 49.9 | 49.3 | 61.1 |
Feb | 54.4 | 50.5 | 53.2 | 49.9 | 61.2 |
Jan | 55.3 | 51.9 | 53.9 | 52.6 | 61.7 |
Dec 2017 | 55.0 | 52.0 | 54.8 | 52.6 | 60.9 |
Nov | 54.8 | 51.8 | 56.2 | 52.8 | 61.6 |
Oct | 54.3 | 51.1 | 54.3 | 51.6 | 60.6 |
Sep | 55.4 | 52.3 | 56.1 | 51.7 | 61.7 |
Aug | 53.4 | 50.9 | 54.4 | 51.5 | 61.0 |
Jul | 54.5 | 51.1 | 53.1 | 50.9 | 61.1 |
Jun | 54.9 | 51.4 | 51.2 | 49.3 | 61.1 |
May | 54.5 | 50.9 | 51.1 | 48.8 | 60.2 |
Apr | 54.0 | 50.5 | 51.7 | 50.2 | 59.7 |
Mar | 55.1 | 51.9 | 52.3 | 49.7 | 61.3 |
Feb | 54.2 | 51.2 | 53.7 | 51.4 | 62.4 |
Jan | 54.6 | 51.3 | 55.1 | 51.0 | 58.9 |
Dec 2016 | 54.5 | 52.1 | 56.2 | 51.9 | 59.5 |
Nov | 54.7 | 51.8 | 53.5 | 51.4 | 60.7 |
Oct | 54.0 | 50.9 | 53.7 | 51.5 | 60.6 |
Sep | 53.7 | 51.4 | 51.7 | 50.1 | 61.1 |
Aug | 53.5 | 49.8 | 52.6 | 50.4 | 59.4 |
Jul | 53.9 | 49.9 | 51.4 | 49.5 | 59.5 |
Jun | 53.7 | 50.8 | 51.6 | 50.6 | 58.6 |
May | 53.1 | 49.2 | 51.6 | 49.8 | 57.8 |
Apr | 53.5 | 48.7 | 52.1 | 49.1 | 59.1 |
Mar | 53.8 | 50.8 | 51.4 | 49.5 | 59.0 |
Feb | 52.7 | 48.7 | 50.5 | 48.3 | 59.5 |
Jan | 53.5 | 49.6 | 49.9 | 47.7 | 58.4 |
Dec2015 | 54.4 | 51.7 | 49.0 | 48.2 | 58.3 |
Nov | 53.6 | 50.2 | 49.3 | 47.7 | 60.0 |
Oct | 53.1 | 51.2 | 51.2 | 48.8 | 61.1 |
Sep | 53.4 | 50.2 | 50.8 | 47.9 | 60.0 |
Aug | 53.4 | 49.6 | 49.6 | 47.8 | 59.7 |
Jul | 53.9 | 50.1 | 48.9 | 47.4 | 60.0 |
Jun | 53.8 | 51.3 | 50.6 | 48.7 | 59.7 |
May | 53.2 | 49.5 | 52.8 | 50.4 | 60.1 |
Apr | 53.4 | 49.1 | 50.8 | 48.9 | 60.0 |
Mar | 53.7 | 50.3 | 50.0 | 48.4 | 58.8 |
Feb | 53.9 | 51.2 | 52.5 | 51.2 | 58.7 |
Jan | 53.7 | 50.2 | 47.6 | 46.9 | 59.6 |
Dec 2014 | 54.1 | 50.5 | 50.1 | 47.3 | 59.5 |
Nov | 53.9 | 50.1 | 50.6 | 47.7 | 59.7 |
Oct | 53.8 | 51.0 | 52.0 | 48.8 | 59.9 |
Sep | 54.0 | 49.5 | 49.8 | 47.3 | 60.9 |
Aug | 54.4 | 50.0 | 52.2 | 48.3 | 61.2 |
Jul | 54.2 | 50.7 | 53.4 | 49.5 | 61.5 |
Jun | 55.0 | 50.7 | 56.0 | 50.8 | 60.4 |
May | 55.5 | 52.7 | 54.5 | 49.0 | 60.7 |
Apr | 54.8 | 50.8 | 52.4 | 49.4 | 61.5 |
Mar | 54.5 | 50.8 | 52.8 | 49.5 | 61.5 |
Feb | 55.0 | 51.4 | 52.1 | 49.0 | 59.9 |
Jan | 53.4 | 50.9 | 54.5 | 50.1 | 58.1 |
Dec 2013 | 54.6 | 51.0 | 56.9 | 52.0 | 58.7 |
Nov | 56.0 | 51.0 | 54.8 | 49.5 | 61.3 |
Oct | 56.3 | 51.6 | 56.1 | 51.4 | 60.5 |
Sep | 55.4 | 53.4 | 56.7 | 50.6 | 60.1 |
Aug | 53.9 | 50.9 | 57.1 | 51.2 | 62.9 |
Jul | 54.1 | 50.3 | 58.2 | 52.4 | 63.9 |
Jun | 53.9 | 50.3 | 55.0 | 50.6 | 61.8 |
May | 54.3 | 50.1 | 54.4 | 50.7 | 62.9 |
Apr | 54.5 | 50.9 | 51.1 | 47.6 | 62.5 |
Mar | 55.6 | 52.0 | 55.3 | 50.0 | 62.4 |
Feb | 54.5 | 51.8 | 56.2 | 51.1 | 62.7 |
Jan | 56.2 | 53.7 | 58.2 | 50.9 | 61.4 |
Dec 2012 | 56.1 | 54.3 | 53.8 | 50.0 | 64.6 |
Nov | 55.6 | 53.2 | 52.5 | 48.4 | 64.6 |
Oct | 55.5 | 51.6 | 58.1 | 50.5 | 63.4 |
Sep | 53.7 | 51.8 | 57.5 | 51.3 | 60.9 |
Aug | 56.3 | 52.7 | 57.6 | 51.2 | 63.2 |
Jul | 55.6 | 53.2 | 49.7 | 48.7 | 63.9 |
Jun | 56.7 | 53.7 | 52.1 | 48.6 | 65.5 |
May | 55.2 | 52.5 | 53.6 | 48.5 | 65.4 |
Apr | 56.1 | 52.7 | 57.9 | 50.3 | 66.1 |
Mar | 58.0 | 53.5 | 60.2 | 52.0 | 66.6 |
Feb | 57.3 | 52.7 | 59.0 | 51.2 | 63.8 |
Jan | 55.7 | 52.2 | 58.2 | 51.1 | 65.3 |
Notes: Interm.: Intermediate; Subs: Subscription; Exp: Business Expectations
Source: National Bureau of Statistics of China
http://www.stats.gov.cn/english/
Chart CIPMNM provides China’s nonmanufacturing purchasing managers’ index. The index fell from 56.0 in Oct 2013 to 53.6 in May 2020.
Chart CIPMNM, China, Nonmanufacturing Index of Purchasing Managers, Seasonally Adjusted
Source: National Bureau of Statistics of China
http://www.stats.gov.cn/english
Table CIPMMFG provides the index of purchasing managers of manufacturing seasonally adjusted of the National Bureau of Statistics of China. The general index (IPM) rose from 50.5 in Jan 2012 to 53.3 in Apr 2012, falling to 49.2 in Aug 2012, rebounding to 50.6 in Dec 2012. The index fell to 50.3 in Jul 2013, barely above the neutral frontier at 50.0, recovering to 51.4 in Nov 2013 but falling to 51.0 in Dec 2013. The index fell to 50.5 in Jan 2014, 50.1 in Dec 2014 and 50.6 in May 2020. The index of new orders fell from 54.5 in Apr 2012 to 51.2 in Dec 2012. The index of new orders fell from 52.3 in Nov 2013 to 52.0 in Dec 2013. The index fell to 50.9 in Jan 2014 and moved to 50.4 in Dec 2014. The index moved to 50.9 in May 2020.
Table CIPMMFG, China, Manufacturing Index of Purchasing Managers, %, Seasonally Adjusted
IPM | PI | NOI | INV | EMP | SDEL | |
2020 | ||||||
May | 50.6 | 53.2 | 50.9 | 47.3 | 49.4 | 50.5 |
Apr | 50.8 | 53.7 | 50.2 | 48.2 | 50.2 | 50.1 |
Mar | 52.0 | 54.1 | 52.0 | 49.0 | 50.9 | 48.2 |
Feb | 35.7 | 27.8 | 29.3 | 33.9 | 31.8 | 32.1 |
Jan | 50.0 | 51.3 | 51.4 | 47.1 | 47.5 | 49.9 |
2019 | ||||||
Dec | 50.2 | 53.2 | 51.2 | 47.2 | 47.3 | 51.1 |
Nov | 50.2 | 52.6 | 51.3 | 47.8 | 47.3 | 50.5 |
Oct | 49.3 | 50.8 | 49.6 | 47.4 | 47.3 | 50.1 |
Sep | 49.8 | 52.3 | 50.5 | 47.6 | 47.0 | 50.5 |
Aug | 49.5 | 51.9 | 49.7 | 47.5 | 46.9 | 50.3 |
Jul | 49.7 | 52.1 | 49.8 | 48.0 | 47.1 | 50.1 |
Jun | 49.4 | 51.3 | 49.6 | 48.2 | 46.9 | 50.2 |
May | 49.4 | 51.7 | 49.8 | 47.4 | 47.0 | 50.9 |
Apr | 50.1 | 52.1 | 51.4 | 47.2 | 47.2 | 49.9 |
Mar | 50.5 | 52.7 | 51.6 | 48.4 | 47.6 | 50.2 |
Feb | 49.2 | 49.5 | 50.6 | 46.3 | 47.5 | 49.8 |
Jan | 49.5 | 50.9 | 49.6 | 48.1 | 47.8 | 50.1 |
2018 | ||||||
Dec | 49.4 | 50.8 | 49.7 | 47.1 | 48.0 | 50.4 |
Nov | 50.0 | 51.9 | 50.4 | 47.4 | 48.3 | 50.3 |
Oct | 50.2 | 52.0 | 50.8 | 47.2 | 48.1 | 49.5 |
Sep | 50.8 | 53.0 | 52.0 | 47.8 | 48.3 | 49.7 |
Aug | 51.3 | 53.3 | 52.2 | 48.7 | 49.4 | 49.6 |
Jul | 51.2 | 53.0 | 52.3 | 48.9 | 49.2 | 50.0 |
Jun | 51.5 | 53.6 | 53.2 | 48.8 | 49.0 | 50.2 |
May | 51.9 | 54.1 | 53.8 | 49.6 | 49.1 | 50.1 |
Apr | 51.4 | 53.1 | 52.9 | 49.5 | 49.0 | 50.2 |
Mar | 51.5 | 53.1 | 53.3 | 49.6 | 49.1 | 50.1 |
Feb | 50.3 | 50.7 | 51.0 | 49.3 | 48.1 | 48.4 |
Jan | 51.3 | 53.5 | 52.6 | 48.8 | 48.3 | 49.2 |
2017 | ||||||
Dec | 51.6 | 54.0 | 53.4 | 48.0 | 48.5 | 49.3 |
Nov | 51.8 | 54.3 | 53.6 | 48.4 | 48.8 | 49.5 |
Oct | 51.6 | 53.4 | 52.9 | 48.6 | 49.0 | 48.7 |
Sep | 52.4 | 54.7 | 54.8 | 48.9 | 49.0 | 49.3 |
Aug | 51.7 | 54.1 | 53.1 | 48.3 | 49.1 | 49.3 |
Jul | 51.4 | 53.5 | 52.8 | 48.5 | 49.2 | 50.1 |
Jun | 51.7 | 54.4 | 53.1 | 48.6 | 49.0 | 49.9 |
May | 51.2 | 53.4 | 52.3 | 48.5 | 49.4 | 50.2 |
Apr | 51.2 | 53.8 | 52.3 | 48.3 | 49.2 | 50.5 |
Mar | 51.8 | 54.2 | 53.3 | 48.3 | 50.0 | 50.3 |
Feb | 51.6 | 53.7 | 53.0 | 48.6 | 49.7 | 50.5 |
Jan | 51.3 | 53.1 | 52.8 | 48.0 | 49.2 | 49.8 |
2016 | ||||||
Dec | 51.4 | 53.3 | 53.2 | 48.0 | 48.9 | 50.0 |
Nov | 51.7 | 53.9 | 53.2 | 48.4 | 49.2 | 49.7 |
Oct | 51.2 | 53.3 | 52.8 | 48.1 | 48.8 | 50.2 |
Sep | 50.4 | 52.8 | 50.9 | 47.4 | 48.6 | 49.9 |
Aug | 50.4 | 52.6 | 51.3 | 47.6 | 48.4 | 50.6 |
Jul | 49.9 | 52.1 | 50.4 | 47.3 | 48.2 | 50.5 |
Jun | 50.0 | 52.5 | 50.5 | 47.0 | 47.9 | 50.7 |
May | 50.1 | 52.3 | 50.7 | 47.6 | 48.2 | 50.4 |
Apr | 50.1 | 52.2 | 51.0 | 47.4 | 47.8 | 50.1 |
Mar | 50.2 | 52.3 | 51.4 | 48.2 | 48.1 | 51.3 |
Feb | 49.0 | 50.2 | 48.6 | 48.0 | 47.6 | 49.8 |
Jan | 49.4 | 51.4 | 49.5 | 46.8 | 47.8 | 50.5 |
2015 | ||||||
Dec | 49.7 | 52.2 | 50.2 | 47.6 | 47.4 | 50.7 |
Nov | 49.6 | 51.9 | 49.8 | 47.1 | 47.6 | 50.6 |
Oct | 49.8 | 52.2 | 50.3 | 47.2 | 47.8 | 50.6 |
Sep | 49.8 | 52.3 | 50.2 | 47.5 | 47.9 | 50.8 |
Aug | 49.7 | 51.7 | 49.7 | 48.3 | 47.9 | 50.6 |
Jul | 50.0 | 52.4 | 49.9 | 48.4 | 48.0 | 50.4 |
Jun | 50.2 | 52.9 | 50.1 | 48.7 | 48.1 | 50.3 |
May | 50.2 | 52.9 | 50.6 | 48.2 | 48.2 | 50.9 |
Apr | 50.1 | 52.6 | 50.2 | 48.2 | 48.0 | 50.4 |
Mar | 50.1 | 52.1 | 50.2 | 48.0 | 48.4 | 50.1 |
Feb | 49.9 | 51.4 | 50.4 | 48.2 | 47.8 | 49.9 |
Jan | 49.8 | 51.7 | 50.2 | 47.3 | 47.9 | 50.2 |
2014 | ||||||
Dec | 50.1 | 52.2 | 50.4 | 47.5 | 48.1 | 49.9 |
Nov | 50.3 | 52.5 | 50.9 | 47.7 | 48.2 | 50.3 |
Oct | 50.8 | 53.1 | 51.6 | 48.4 | 48.4 | 50.1 |
Sep | 51.1 | 53.6 | 52.2 | 48.8 | 48.2 | 50.1 |
Aug | 51.1 | 53.2 | 52.5 | 48.6 | 48.2 | 50.0 |
Jul | 51.7 | 54.2 | 53.6 | 49.0 | 48.3 | 50.2 |
Jun | 51.0 | 53.0 | 52.8 | 48.0 | 48.6 | 50.5 |
May | 50.8 | 52.8 | 52.3 | 48.0 | 48.2 | 50.3 |
Apr | 50.4 | 52.5 | 51.2 | 48.1 | 48.3 | 50.1 |
Mar | 50.3 | 52.7 | 50.6 | 47.8 | 48.3 | 49.8 |
Feb | 50.2 | 52.6 | 50.5 | 47.4 | 48.0 | 49.9 |
Jan | 50.5 | 53.0 | 50.9 | 47.8 | 48.2 | 49.8 |
Dec 2013 | 51.0 | 53.9 | 52.0 | 47.6 | 48.7 | 50.5 |
Nov | 51.4 | 54.5 | 52.3 | 47.8 | 49.6 | 50.6 |
Oct | 51.4 | 54.4 | 52.5 | 48.6 | 49.2 | 50.8 |
Sep | 51.1 | 52.9 | 52.8 | 48.5 | 49.1 | 50.8 |
Aug | 51.0 | 52.6 | 52.4 | 48.0 | 49.3 | 50.4 |
Jul | 50.3 | 52.4 | 50.6 | 47.6 | 49.1 | 50.1 |
Jun | 50.1 | 52.0 | 50.4 | 47.4 | 48.7 | 50.3 |
May | 50.8 | 53.3 | 51.8 | 47.6 | 48.8 | 50.8 |
Apr | 50.6 | 52.6 | 51.7 | 47.5 | 49.0 | 50.8 |
Mar | 50.9 | 52.7 | 52.3 | 47.5 | 49.8 | 51.1 |
Feb | 50.1 | 51.2 | 50.1 | 49.5 | 47.6 | 48.3 |
Jan | 50.4 | 51.3 | 51.6 | 50.1 | 47.8 | 50.0 |
Dec 2012 | 50.6 | 52.0 | 51.2 | 47.3 | 49.0 | 48.8 |
Nov | 50.6 | 52.5 | 51.2 | 47.9 | 48.7 | 49.9 |
Oct | 50.2 | 52.1 | 50.4 | 47.3 | 49.2 | 50.1 |
Sep | 49.8 | 51.3 | 49.8 | 47.0 | 48.9 | 49.5 |
Aug | 49.2 | 50.9 | 48.7 | 45.1 | 49.1 | 50.0 |
Jul | 50.1 | 51.8 | 49.0 | 48.5 | 49.5 | 49.0 |
Jun | 50.2 | 52.0 | 49.2 | 48.2 | 49.7 | 49.1 |
May | 50.4 | 52.9 | 49.8 | 45.1 | 50.5 | 49.0 |
Apr | 53.3 | 57.2 | 54.5 | 48.5 | 51.0 | 49.6 |
Mar | 53.1 | 55.2 | 55.1 | 49.5 | 51.0 | 48.9 |
Feb | 51.0 | 53.8 | 51.0 | 48.8 | 49.5 | 50.3 |
Jan | 50.5 | 53.6 | 50.4 | 49.7 | 47.1 | 49.7 |
IPM: Index of Purchasing Managers; PI: Production Index; NOI: New Orders Index; EMP: Employed Person Index; SDEL: Supplier Delivery Time Index
Source: National Bureau of Statistics of China
http://www.stats.gov.cn/english/
China estimates the manufacturing index of purchasing managers on the basis of a sample of 820 enterprises (http://www.stats.gov.cn/english/pressrelease/t20121009_402841094.htm). Chart CIPMMFG provides the manufacturing index of purchasing managers. The index fell to 50.1 in Jun 2013. The index decreased from 51.4 in Nov 2013 to 51.0 in Dec 2013. The index moved to 50.6 in May 2020.
Chart CIPMMFG, China, Manufacturing Index of Purchasing Managers, Seasonally Adjusted
Source: National Bureau of Statistics of China
http://www.stats.gov.cn/english
Chart CIPCOMP provides China’s composite, manufacturing and nonmanufacturing, index. The index remains above the neutral 50.0, moving to 53.4 in May 2020.
Chart CIPCOMP, China, Composite Index of Purchasing Managers, Seasonally Adjusted
Source: National Bureau of Statistics of China
http://www.stats.gov.cn/english
Growth of China’s GDP in IQ2020 relative to the same period in 2019 was minus 6.8 percent and cumulative growth to IQ2020 was minus 6.8 percent in the COVID-19 event, as shown in Table VC-GDP. Secondary industry accounts for 35.7 percent of cumulative GDP in IQ2020. Tertiary industry accounts for 59.4 percent of cumulative GDP in IQ2020 and primary industry for 4.9 percent. China’s growth strategy consisted of rapid increases in productivity in industry to absorb population from agriculture where incomes are lower (Pelaez and Pelaez, The Global Recession Risk (2007), 56-80). The strategy is shifting to lower growth rates with improvement in living standards by increasing growth of services. The bottom block of Table VC-GDP provides quarter-on-quarter growth rates of GDP and their annual equivalent. China’s GDP growth decelerated significantly from annual equivalent 10.0 percent in IQ2011 to 6.1 percent in IVQ2011 and 7.8 percent in IQ2012, rebounding to 8.7 percent in IIQ2012, 7.4 percent in IIIQ2012 and 8.2 percent in IVQ2012. Annual equivalent growth in IQ2013 eased to 7.8 percent and to 7.4 percent in IIQ2013, rebounding to 8.7 percent in IIIQ2013. Annual equivalent growth was 6.6 percent in IVQ2013, stabilizing to 7.4 percent in IQ2014 and to 7.4 percent in IIQ2014. Annual equivalent growth stabilized at 7.4 percent in IIIQ2014 and 7.0 percent in IVQ2014. Growth moved to annual equivalent 7.4 percent in IQ2015, 7.4 percent in IIQ2015 and 7.0 percent in IIIQ2015. Growth slowed to 6.6 percent in annual equivalent in IVQ2015 and 6.1 percent in IQ2016. Growth increased to annual equivalent 7.4 percent in IIQ2016 and 7.0 percent in IIIQ2016, decreasing to 6.6 percent in IVQ2016. Growth accelerated to annual equivalent 7.0 percent in IQ2017, accelerating to 7.4 percent in IIQ2017 and decelerating at 6.6 percent in IIIQ2017. Growth decelerated to 6.1 percent annual equivalent in IVQ2017. Growth accelerated to 7.0 percent annual equivalent in IQ2018, stabilizing to 7.0 percent in IIQ2018. Growth delerated to annual equivalent 6.1 percent in IIIQ2018, stabilizing to 6.1 percent annual equivalent in IVQ2018. Growth accelerated to 6.6 percent annual equivalent in IQ2019, decelerating to 6.1 percent in IIQ2019. Growth decelerated to 5.3 percent annual equivalent in IIIQ2019, accelerating to 6.1 percent annual equivalent in IVQ2019. GDP contracted at annual equivalent 71.0 percent in IQ2020 in the COVID-19 event.
Table VC-GDP China, Quarterly Growth of GDP, Current CNY 100 Million and Inflation Adjusted ∆%
Cumulative GDP IQ2020 | Value Current CNY Billion IQ2020 | Value Current CNY Billion IQ2020 to IQ2020 | IQ2020 Year-on-Year Constant Prices ∆% | Cumulative to IQ2020 ∆% |
GDP | 20,650.4 | 20,650.4 | -6.8 | -6.8 |
Primary Industry | 1,018.6 | 1,018.6 | -3.2 | -3.2 |
Secondary Industry | 7,363.8 | 7,363.8 | -9.6 | -9.6 |
Tertiary Industry | 12,268.0 | 12,268.0 | -5.2 | -5.2 |
Growth in Quarter Relative to Prior Quarter | ∆% on Prior Quarter | ∆% Annual Equivalent | ∆% Year-on-Year | |
2020 | ||||
IQ2020 | -9.8 | -71.0 | -6.8 | |
IVQ2019 | 1.5 | 6.1 | 6.0 | |
IIIQ2019 | 1.3 | 5.3 | 6.0 | |
IIQ2019 | 1.5 | 6.1 | 6.2 | |
IQ2019 | 1.6 | 6.6 | 6.4 | |
2018 | ||||
IVQ2018 | 1.5 | 6.1 | 6.5 | |
IIIQ2018 | 1.5 | 6.1 | 6.7 | |
IIQ2018 | 1.7 | 7.0 | 6.9 | |
IQ2018 | 1.7 | 7.0 | 6.9 | |
2017 | ||||
IVQ2017 | 1.5 | 6.1 | 6.8 | |
IIIQ2017 | 1.6 | 6.6 | 6.9 | |
IIQ2017 | 1.8 | 7.4 | 7.0 | |
IQ2017 | 1.7 | 7.0 | 7.0 | |
2016 | ||||
IVQ2016 | 1.6 | 6.6 | 6.9 | |
IIIQ2016 | 1.7 | 7.0 | 6.8 | |
IIQ2016 | 1.8 | 7.4 | 6.8 | |
IQ2016 | 1.5 | 6.1 | 6.9 | |
2015 | ||||
IVQ2015 | 1.6 | 6.6 | 6.9 | |
IIIQ2015 | 1.7 | 7.0 | 7.0 | |
IIQ2015 | 1.8 | 7.4 | 7.1 | |
IQ2015 | 1.8 | 7.4 | 7.1 | |
2014 | ||||
IVQ2014 | 1.7 | 7.0 | 7.3 | |
IIIQ2014 | 1.8 | 7.4 | 7.2 | |
IIQ2014 | 1.8 | 7.4 | 7.6 | |
IQ2014 | 1.8 | 7.4 | 7.5 | |
2013 | ||||
IVQ2013 | 1.6 | 6.6 | 7.7 | |
IIIQ2013 | 2.1 | 8.7 | 7.9 | |
IIQ2013 | 1.8 | 7.4 | 7.6 | |
IQ2013 | 1.9 | 7.8 | 7.9 | |
2012 | ||||
IVQ2012 | 2.0 | 8.2 | 8.1 | |
IIIQ2012 | 1.8 | 7.4 | 7.5 | |
IIQ2012 | 2.1 | 8.7 | 7.6 | |
IQ2012 | 1.9 | 7.8 | 8.1 | |
2011 | ||||
IVQ2011 | 1.5 | 6.1 | 8.8 | |
IIIQ2011 | 1.9 | 7.8 | 9.4 | |
IIQ2011 | 2.4 | 10.0 | 10.0 | |
IQ2011 | 2.4 | 10.0 | 10.2 |
Source: National Bureau of Statistics of China http://www.stats.gov.cn/english/
Growth of China’s GDP in IQ2020 relative to the same period in 2019 was minus 6.8 percent and cumulative growth to IQ2020 was minus 6.8 percent in the COVID-19 event, as shown in Table VC-GDP. Secondary industry accounts for 35.7 percent of cumulative GDP in IQ2020. Tertiary industry accounts for 59.4 percent of cumulative GDP in IQ2020 and primary industry for 4.9 percent. China’s growth strategy consisted of rapid increases in productivity in industry to absorb population from agriculture where incomes are lower (Pelaez and Pelaez, The Global Recession Risk (2007), 56-80). The strategy is shifting to lower growth rates with improvement in living standards by increasing growth of services. Table VC-GDPA shows that growth decelerated from 12.1 percent in IQ2010 and 11.2 percent in IIQ2010 to 7.9 percent in IQ2013, 7.6 percent in IIQ2013 and 7.9 percent in IIIQ2013. GDP grew 7.7 percent in IVQ2013 relative to a year earlier and 1.6 percent relative to IIIQ2013, which is equivalent to 6.6 percent per year. GDP grew 7.5 percent in IQ2014 relative to a year earlier and 1.8 percent in IQ2014 that is equivalent to 7.4 percent per year. GDP grew 7.6 percent in IIQ2014 relative to a year earlier and 1.8 percent relative to the prior quarter, which is annual equivalent 7.4 percent. In IIIQ2014, GDP grew 7.2 percent relative to a year earlier and 1.8 percent relative to the prior quarter, which is 7.4 percent in annual equivalent. GDP grew 1.7 percent in IVQ2014, which is 7.0 percent in annual equivalent and 7.3 percent relative to a year earlier. In IQ2015, GDP grew 1.8 percent, which is equivalent to 7.4 in a year and 7.1 percent relative to a year earlier. GDP grew 1.8 percent in IIQ2015, which is equivalent to 7.4 percent in a year, and grew 7.1 percent relative to a year earlier. GDP grew at 1.7 percent in IIIQ2015, which is equivalent to 7.0 percent in a year, and grew 7.0 percent relative to a year earlier. GDP grew at 1.6 percent in IVQ2015, which is equivalent to 6.6 percent in a year and increased 6.9 percent relative to a year earlier. In IQ2016, GDP grew at 1.5 percent, which is equivalent to 6.1 percent in a year, and increased 6.9 percent relative to a year earlier. GDP grew at 1.8 percent in IIQ2016, which is annual equivalent to 7.4 percent, and increased 6.8 percent relative to a year earlier. In IIIQ2016, GDP grew at 1.7 percent, which is equivalent to 7.0 percent in a year and increased 6.8 percent relative to a year earlier. In IVQ2016, GDP grew at 1.6 percent, equivalent to 6.6 percent in a year, and increased 6.9 percent relative to a year earlier. GDP grew 7.0 percent in IQ2017 relative to a year earlier and increased at 1.7 percent, which is 7.0 percent in annual equivalent. In IIQ2017, GDP grew at 1.8 percent, which is annual equivalent at 7.4 percent, and increased 7.0 percent relative to a year earlier. GDP grew at 1.6 percent in IIIQ2017, which is annual equivalent at 6.6 percent, and increased at 6.9 percent relative to a year earlier. In IVQ2017, GDP grew 1.5 percent, which is annual equivalent to 6.1 percent, and increased 6.8 percent relative to a year earlier. GDP grew at 1.7 percent in IQ2018, which is annual equivalent at 7.0 percent, and increased 6.9 percent relative to a year earlier. In IIQ2018, GDP grew at 1.7 percent, which is annual equivalent to 7.0 percent, and increased 6.9 percent relative to a year earlier. GDP grew at 1.5 percent in IIIQ2018, which is annual equivalent at 6.1 percent, and increased 6.7 percent relative to a year earlier. In IVQ2018, GDP grew at 1.5 percent, which is annual equivalent to 6.1 percent, and increased 6.5 percent relative to a year earlier. GDP grew at 1.6 percent in IQ2019, which is annual equivalent to 6.6 percent, and increased 6.4 percent relative to a year earlier. In IIQ2019, GDP grew at 1.5 percent, which is annual equivalent to 6.1 percent and increased 6.2 percent relative to a year earlier. GDP grew at 1.3 percent in IIIQ2019, which is annual equivalent to 5.3 percent, and increased 6.0 percent relative to a year earlier. In IVQ2019, GDP grew at 1.5 percent, which is annual equivalent to 6.1 percent, and increased 6.0 percent relative to a year earlier. GDP contracted minus 9.8 percent in IQ2020, which is annual equivalent to minus 71.0 percent, and contracted minus 6.8 percent in IQ2020, in the COVID-19 event.
Table VC-GDPA China, Growth Rate of GDP, ∆% Relative to a Year Earlier and ∆% Relative to Prior Quarter
IQ2020 | ||||
GDP | -6.8 | |||
Primary Industry | -3.2 | |||
Secondary Industry | -9.6 | |||
Tertiary Industry | -5.2 | |||
GDP ∆% Relative to a Prior Quarter | -9.8 (-71.0) | |||
IQ2019 | IIQ2019 | IIIQ2019 | IVQ2019 | |
GDP | 6.4 | 6.2 | 6.0 | 6.0 |
Primary Industry | 2.7 | 3.3 | 2.7 | 3.4 |
Secondary Industry | 6.1 | 5.6 | 5.2 | 5.8 |
Tertiary Industry | 7.0 | 7.0 | 7.2 | 6.6 |
GDP ∆% Relative to a Prior Quarter | 1.6 (6.6) | 1.5 (6.1) | 1.3 (5.3) | 1.5 (6.1) |
IQ2018 | IIQ2018 | IIIQ2018 | IVQ2018 | |
GDP | 6.9 | 6.9 | 6.7 | 6.5 |
Primary Industry | 3.2 | 3.2 | 3.6 | 3.5 |
Secondary Industry | 6.3 | 6.0 | 5.3 | 5.8 |
Tertiary Industry | 7.5 | 7.8 | 7.9 | 7.4 |
GDP ∆% Relative to a Prior Quarter | 1.7 (7.0) | 1.7 (7.0) | 1.5 (6.1) | 1.5 (6.1) |
IQ2017 | IIQ2017 | IIIQ2017 | IVQ2017 | |
GDP | 7.0 | 7.0 | 6.9 | 6.8 |
Primary Industry | 3.0 | 3.8 | 3.9 | 4.4 |
Secondary Industry | 6.4 | 6.4 | 6.0 | 5.7 |
Tertiary Industry | 7.7 | 7.6 | 8.0 | 8.3 |
GDP ∆% Relative to a Prior Quarter | 1.7 (7.0) | 1.8 (7.4) | 1.6 (6.6) | 1.5 (6.1) |
IQ2016 | IIQ2016 | IIIQ2016 | IVQ2016 | |
GDP | 6.9 | 6.8 | 6.8 | 6.9 |
Primary Industry | 2.9 | 3.1 | 3.5 | 2.9 |
Secondary Industry | 5.8 | 6.3 | 6.1 | 6.1 |
Tertiary Industry | 7.6 | 7.5 | 7.6 | 8.3 |
GDP ∆% Relative to a Prior Quarter | 1.5 (6.1) | 1.8 (7.4) | 1.7 (7.0) | 1.6 (6.6) |
IQ2015 | IIQ2015 | IIIQ2015 | IVQ2015 | |
GDP | 7.1 | 7.1 | 7.0 | 6.9 |
Primary Industry | 3.2 | 3.5 | 3.8 | 4.1 |
Secondary Industry | 6.4 | 6.1 | 6.0 | 6.1 |
Tertiary Industry | 7.9 | 8.4 | 8.4 | 8.2 |
GDP ∆% Relative to a Prior Quarter | 1.8 (7.4) | 1.8 (7.4) | 1.7 (7.0) | 1.6 (6.6) |
IQ2014 | IIQ2014 | IIIQ2014 | IVQ2014 | |
GDP | 7.5 | 7.6 | 7.2 | 7.3 |
Primary Industry | 3.5 | 3.9 | 4.2 | 4.1 |
Secondary Industry | 7.3 | 7.4 | 7.4 | 7.3 |
Tertiary Industry | 7.1 | 8.0 | 7.9 | 8.1 |
GDP ∆% Relative to a Prior Quarter | 1.8 (7.4) | 1.8 (7.4) | 1.8 (7.4) | 1.7 (7.0) |
IQ2013 | IIQ2013 | IIIQ2013 | IVQ2013 | |
GDP | 7.9 | 7.6 | 7.9 | 7.7 |
Primary Industry | 3.4 | 3.0 | 3.4 | 4.0 |
Secondary Industry | 7.8 | 7.6 | 7.8 | 7.8 |
Tertiary Industry | 8.3 | 8.3 | 8.4 | 8.3 |
GDP ∆% Relative to a Prior Quarter | 1.9 (7.8) | 1.8 (7.4) | 2.1 (8.7) | 1.6 (6.6) |
IQ2012 | IIQ2012 | IIIQ2012 | IVQ2012 | |
GDP | 8.1 | 7.6 | 7.5 | 8.1 |
Primary Industry | 3.8 | 4.3 | 4.2 | 4.5 |
Secondary Industry | 9.1 | 8.3 | 8.1 | 8.1 |
Tertiary Industry | 7.5 | 7.7 | 7.9 | 8.1 |
GDP ∆% Relative to a Prior Quarter | 1.9 (7.8) | 2.1 (8.7) | 1.8 (7.4) | 2.0 (8.2) |
IQ2011 | IIQ2011 | IIIQ2011 | IVQ2011 | |
GDP | 10.2 | 10.0 | 9.4 | 8.8 |
Primary Industry | 3.5 | 3.2 | 3.8 | 4.5 |
Secondary Industry | 11.1 | 11.0 | 10.8 | 10.6 |
Tertiary Industry | 9.1 | 9.2 | 9.0 | 8.9 |
GDP ∆% Relative to a Prior Quarter | 2.4 (10.0) | 2.4 (10.0) | 1.9 (7.8) | 1.5 (6.1) |
IQ2010 | IIQ2010 | IIIQ2010 | IVQ2010 | |
GDP | 12.1 | 11.2 | 10.7 | 12.1 |
Primary Industry | 3.8 | 3.6 | 4.0 | 3.8 |
Secondary Industry | 14.5 | 13.3 | 12.6 | 14.5 |
Tertiary Industry | 10.5 | 9.9 | 9.7 | 10.5 |
Source: National Bureau of Statistics of China http://www.stats.gov.cn/english/
Growth of China’s GDP in IVQ2016 relative to the same period in 2016 was 6.8 percent and
Chart VC-GDP of the National Bureau of Statistics of China provides annual value and growth rates of GDP. China’s GDP growth in 2016 is still high at 6.7 percent but at the lowest rhythm in five years.
Chart VC-GDP, China, Gross Domestic Product, Million Yuan and ∆%
Source: National bureau of Statistics of China http://www.stats.gov.cn/english/
Chart VC-FXR provides China’s foreign exchange reserves. FX reserves grew from $2399.2 billion in 2009 to $38430 billion in 2013 driven by high growth of China’s trade surplus, decreasing to $30105 billion in 2016.
Chart VC-FXR, China, Foreign Exchange Reserves, 2012-2016
Source: National Bureau of Statistics of China http://www.stats.gov.cn/english
Chart VC-Trade provides China’s imports and exports. Exports exceeded imports with resulting large trade balance surpluses that increased foreign exchange reserves.
Chart VC-Trade, China, Imports and Exports of Goods, 2012-2016, $100 Million US Dollars
Source: National Bureau of Statistics of China http://www.stats.gov.cn/english
Chart VC-PCDI provides the level and growth rates of per capita disposable income in China.
Chart VC-PCDI, China, Level and Growth Rates of Per Capita Disposable Income
Source: National Bureau of Statistics of China http://www.stats.gov.cn/english
The Caixin Flash China General Manufacturing Purchasing Managers’ Index™ (PMI™) compiled by Markit (http://www.markiteconomics.com/Survey//PressRelease.mvc/883014a121534f51bc42e5060845f727) is mixed. The overall Flash Caixin China General Manufacturing PMI™ decreased from 47.3 in Aug to 47.0 in Sep, while the Flash Caixin China General Manufacturing Output Index decreased from 46.4 in Aug to 45.7 in Sep, indicating weaker conditions. He Fan, Chief Economist at Caixin Insight Group finds need of fiscal and monetary policy (http://www.markiteconomics.com/Survey//PressRelease.mvc/883014a121534f51bc42e5060845f727). The Caixin China General Services PMI™, compiled by Markit, shows that the Caixin Composite Output, combining manufacturing and services, increased from 47.6 in Apr to 54.5 in May (https://www.markiteconomics.com/Public/Home/PressRelease/e2faca3a3cc549e88b9091439705c8fa). Dr. Zhengsheng Zhong, Chairman and Chief Economist at CEBM Group, finds recovering activity (https://www.markiteconomics.com/Public/Home/PressRelease/e2faca3a3cc549e88b9091439705c8fa). The Caixin General Manufacturing PMI™ increased to 50.7 in May from 49.4 in Apr, indicating expanding conditions in manufacturing (https://www.markiteconomics.com/Public/Home/PressRelease/976d7a2e5fa84d70be58464da10f7ff9). Dr. Zhengsheng Zhong, Chairman and Chief Economist at CEBM Group, finds recovering growth conditions (https://www.markiteconomics.com/Public/Home/PressRelease/976d7a2e5fa84d70be58464da10f7ff9). Table CNY provides the country data table for China.
Table CNY, China, Economic Indicators
Price Indexes for Industry | May 12-month ∆%: -3.7 May month ∆%: -0.4 |
Consumer Price Index | May 12-month ∆%: 3.3 May month ∆%: -0.9 |
Value Added of Industry | Apr month ∆%: 2.3% Apr 12 month ∆%: 3.9 Jan-Apr 2020/Jan-Apr 2019 ∆%: -4.9 Earlier Data |
GDP Growth Rate | Year-on-Year IQ2020 ∆%: minus 6.8 I Quarter 2020 ∆%: minus 9.8 |
Investment in Fixed Assets | Total Jan-Apr 2020 ∆%: -10.3 Real estate development: ∆% minus 3.3 Earlier Data: |
Retail Sales | Apr month ∆%: 0.3 %, Mar 0.4%. Earlier Data: |
Trade Balance | Balance $62.93 B Exports 12M ∆% -3.3 Imports 12M ∆% -16.7 Cumulative 2019 Balance $424.9 Dec 2019 Balance $46.79 billion Exports 12M ∆% 7.6 Imports 12M ∆% 16.3 Dec 2018 $56.80 billion Exports 12M ∆% -1.1 Imports 12M ∆% 0.3 Dec 2018 balance 57.06 billion Dec 2017 balance $53.85 billion 2018 Exports ∆% 9.9 2018 Imports ∆% 15.8 2017 Exports ∆% 7.9 2017 Imports ∆% 15.9 2016 Exports ∆% 11.3 2016 Imports ∆% 17.3 Cumulative Dec 2018: $351.76 Cumulative Dec 2017: $422.50 billion Cumulative Dec 2016: $486.0 Earlier Data: |
Links to blog comments in Table CNY: 6/14/20 https://cmpassocregulationblog.blogspot.com/2020/06/global-recession-with-output-in-us.html
5/24/2020 https://cmpassocregulationblog.blogspot.com/2020/05/recovery-without-hiring-twenty-million.html
5/10/20 https://cmpassocregulationblog.blogspot.com/2020/05/fifty-two-million-unemployed-or.html
4/26/20 https://cmpassocregulationblog.blogspot.com/2020/04/valuations-of-risk-financial-assets.html
3/15/20 https://cmpassocregulationblog.blogspot.com/2020/03/financial-markets-stress-in.html
2/16/20 https://cmpassocregulationblog.blogspot.com/2020/02/recovery-without-hiring-in-lost.html
2/2/2020 https://cmpassocregulationblog.blogspot.com/2020/02/decreasing-valuations-of-risk-financial.html
1/19/20 https://cmpassocregulationblog.blogspot.com/2020/01/rising-valuations-of-risk-financial.html
12/15/19 https://cmpassocregulationblog.blogspot.com/2019/12/increase-in-valuations-of-risk_14.html
11/17/19 https://cmpassocregulationblog.blogspot.com/2019/11/increasing-valuations-of-risk-financial_16.html
11/3/19 https://cmpassocregulationblog.blogspot.com/2019/11/decrease-of-fomc-policy-rate-monetary.html
10/20/19 https://cmpassocregulationblog.blogspot.com/2019/10/dollar-depreciation-fluctuating.html
9/15/19 https://cmpassocregulationblog.blogspot.com/2019/09/competitive-exchange-rate-and-interest.html
7/28/19 https://cmpassocregulationblog.blogspot.com/2019/07/dollar-appreciation-in-anticipations-of.html
7/14/19 https://cmpassocregulationblog.blogspot.com/2019/07/fomc-uncertain-outlook-frank-h-knights.html
4/28/19 https://cmpassocregulationblog.blogspot.com/2019/04/high-levels-of-valuations-of-risk.html
4/19/2015 http://cmpassocregulationblog.blogspot.com/2015/04/global-portfolio-reallocations-squeeze.html
VD Euro Area. Using calendar and seasonally adjusted chain-linked volumes (https://ec.europa.eu/eurostat/), the GDP of the euro area (19 countries) fell 5.7 percent from IQ2008 to IIQ2009. The GDP of the euro area (19 countries) increased 11.2 percent from IIIQ2009 to IQ2020 at the annual equivalent rate of 1.0 percent. The GDP of the euro area (19 countries) is higher by 4.9 percent in IQ2020 relative to the pre-recession peak in IQ2008, growing at annual equivalent rate of 0.4 percent. The GDP of the euro area (18) countries increased at the average yearly rate of 2.3 percent from IQ1999 to IQ2008 while that of the euro area (19 countries) increased at 2.3 percent. The GDP of the euro area (19 countries) grew at 2.3 percent annual equivalent from IQ1999 to the pre-recession peak in IQ2008. The GDP of the euro area would grow under trend of 2.3 percent from €2,614,575.5 million in IQ2008 to €3,434,858.0 million in IQ2020. The estimate of GDP of €2,742,420.4 million in IQ2020 is 20.2 percent below trend. Table VD-EUR provides yearly growth rates of the combined GDP of the members of the European Monetary Union (EMU) or euro area since 1999. Growth was very strong at 3.2 percent in 2006 and 3.0 percent in 2007. The global recession had strong impact with growth of only 0.4 percent in 2008 and decline of 4.5 percent in 2009. Recovery was at lower growth rates of 2.1 percent in 2010 and 1.5 percent in 2011. EUROSTAT estimates growth of GDP of the euro area of minus 0.9 percent in 2012 and minus 0.3 percent in 2013. Euro Area GDP grew 1.2 percent in 2014 and grew 2.0 percent in 2015. The GDP of the euro area grew 1.7 percent in 2016.
Table VD-EUR, Euro Area, Yearly Percentage Change of Harmonized Index of Consumer Prices, Unemployment and GDP ∆%
Year | HICP ∆% | Unemployment | GDP ∆% |
1999 | 1.2 | 9.7 | 3.0 |
2000 | 2.2 | 8.9 | 3.8 |
2001 | 2.4 | 8.3 | 2.1 |
2002 | 2.3 | 8.6 | 1.0 |
2003 | 2.1 | 9.1 | 0.7 |
2004 | 2.2 | 9.3 | 2.3 |
2005 | 2.2 | 9.1 | 1.7 |
2006 | 2.2 | 8.4 | 3.2 |
2007 | 2.2 | 7.5 | 3.0 |
2008 | 3.3 | 7.6 | 0.4 |
2009 | 0.3 | 9.6 | -4.5 |
2010 | 1.6 | 10.2 | 2.1 |
2011 | 2.7 | 10.2 | 1.5 |
2012 | 2.5 | 11.4 | -0.9 |
2013 | 1.3 | 12.0 | -0.3 |
2014 | 0.4 | 11.6 | 1.2 |
2015 | 0.0 | 10.9 | 2.0 |
2016 | 0.2 | 10.0 | 1.7 |
https://ec.europa.eu/eurostat/
https://ec.europa.eu/eurostat/data/database
The GDP of the euro area in 2015 in current US dollars in the dataset of the World Economic Outlook (WEO) of the International Monetary Fund (IMF) is $11,990.9 billion or 16.3 percent of world GDP of $73,598.8 billion (http://www.imf.org/external/pubs/ft/weo/2016/02/weodata/index.aspx). The sum of the GDP of France $2420.2 billion with the GDP of Germany of $3365.3 billion, Italy of $1815.8 billion and Spain $1199.7 billion is $8,801.0 billion or 73.4 percent of total euro area GDP and 13.1 percent of World GDP. The four largest economies account for slightly more than three quarters of economic activity of the euro area. Table VD-EUR1 is constructed with the dataset of EUROSTAT, providing growth rates of the euro area as a whole and of the largest four economies of Germany, France, Italy and Spain annually from 1996 to 2016. The impact of the global recession on the overall euro area economy and on the four largest economies was quite strong. There was sharp contraction in 2009 and growth rates have not rebounded to earlier growth with exception of Germany in 2010 and 2011.
Table VD-EUR1, Euro Area, Real GDP Growth Rate, ∆%
Euro Area | Germany | France | Italy | Spain | |
2016 | 1.7 | 1.9 | 1.2 | 0.9 | 3.2 |
2015 | 2.0 | 1.7 | 1.3 | 0.8 | 3.2 |
2014 | 1.2 | 1.6 | 0.6 | 0.1 | 1.4 |
2013 | -0.3 | 0.5 | 0.6 | -1.7 | -1.7 |
2012 | -0.9 | 0.5 | 0.2 | -2.8 | -2.9 |
2011 | 1.5 | 3.7 | 2.1 | 0.6 | -1.0 |
2010 | 2.1 | 4.1 | 2.0 | 1.7 | 0.0 |
2009 | -4.5 | -5.6 | -2.9 | -5.5 | -3.6 |
2008 | 0.4 | 1.1 | 0.2 | -1.1 | 1.1 |
2007 | 3.0 | 3.3 | 2.4 | 1.5 | 3.8 |
2006 | 3.2 | 3.7 | 2.4 | 2.0 | 4.2 |
2005 | 1.7 | 0.7 | 1.6 | 0.9 | 3.7 |
2004 | 2.3 | 1.2 | 2.8 | 1.6 | 3.2 |
2003 | 0.7 | -0.7 | 0.8 | 0.2 | 3.2 |
2002 | 1.0 | 0.0 | 1.1 | 0.2 | 2.9 |
2001 | 2.1 | 1.7 | 2.0 | 1.8 | 4.0 |
2000 | 3.8 | 3.0 | 3.9 | 3.7 | 5.3 |
1999 | 3.0 | 2.0 | 3.4 | 1.6 | 4.5 |
1998 | 2.9 | 2.0 | 3.6 | 1.6 | 4.3 |
Average 1999-2016 | 1.2 | 1.3 | 1.3 | 0.3 | 1.7 |
Average 1999-2007 | 2.2 | 1.6 | 2.1 | 1.5 | 3.8 |
Average 2016-2007 | 0.3 | 1.0 | 0.6 | -7.0* | -0.5* |
1997 | 2.6 | 1.8 | 2.3 | 1.8 | 3.7 |
1996 | 1.6 | 0.8 | 1.4 | 1.3 | 2.7 |
Note: Absolute percentage change
Source: EUROSTAT
https://ec.europa.eu/eurostat/
https://ec.europa.eu/eurostat/data/database
The Flash Eurozone PMI Composite Output Index of the HIS Markit Flash Eurozone PMI®, combining activity in manufacturing and services, increased from 13.6 in Apr to 30.5 in May (https://www.markiteconomics.com/Public/Home/PressRelease/7b038676295949b78d6114bb6005c368). Chris Williamson, Associate Director at IHS Markit, finds that the Markit Flash Eurozone PMI index suggests GDP contracting at quarterly rate close to 10.0 percent (https://www.markiteconomics.com/Public/Home/PressRelease/7b038676295949b78d6114bb6005c368). The IHS Markit Eurozone PMI® Composite Output Index, combining services and manufacturing activity with close association with GDP increased from 13.6 in Apr to 31.9 in May (https://www.markiteconomics.com/Public/Home/PressRelease/6577650d2ad8424ebbb2670f1d3541d7). Chris Williamson, Chief Business Economist at IHS Markit, finds slower potential for contraction at around 9.0 percent in GDP ((https://www.markiteconomics.com/Public/Home/PressRelease/6577650d2ad8424ebbb2670f1d3541d7). The IHS Markit Eurozone Services Business Activity Index increased from 12.0 in Apr to 30.5 in May ((https://www.markiteconomics.com/Public/Home/PressRelease/6577650d2ad8424ebbb2670f1d3541d7). The IHS Markit Eurozone Manufacturing PMI® increased from 33.4 in Apr to 39.4 in May (https://www.markiteconomics.com/Public/Home/PressRelease/687f08fa4a6c4996ac315ef9041278dd). New export orders decreased. Chris Williamson, Chief Business Economist at IHS Markit, finds contracting conditions (https://www.markiteconomics.com/Public/Home/PressRelease/687f08fa4a6c4996ac315ef9041278dd). Table EUR provides the data table for the euro area.
Table EUR, Euro Area Economic Indicators
GDP | IQ2020 ∆% -3.6; IQ2020/IQ2019 ∆% -3.1 Blog 9/13/15 11/22/15 12/13/15 2/14/16 3/13/16 5/1/16 5/15/16 6/12/16 8/7/16 8/14/16 9/11/16 11/20/16 12/11/16 02/26/17 3/12/17 5/21/17 6/11/17 8/20/17 9/10/17 11/26/17 12/10/17 2/18/18 3/11/18 5/20/18 6/10/18 8/19/18 9/16/18 11/18/18 12/16/18 3/10/19 5/26/19 6/9/19 9/15/19 12/29/19 3/22/20 6/14/20 |
Unemployment | Apr 2020: 7.3 % unemployment rate; Apr 2020: 11.919 million unemployed Blog 6/7/20 |
HICP | Apr month ∆%: 0.3 12 months Apr ∆%: 0.3 |
Producer Prices | Euro Zone industrial producer prices Apr ∆%: -2.0 |
Industrial Production | Mar Month ∆%: -11.3; 12 months ∆%: -19.6 Earlier Data: |
Retail Sales | Apr month ∆%: -11.7 Earlier Data: |
Confidence and Economic Sentiment Indicator | Sentiment 67.0 Apr 2020 Consumer -22.7 Feb 2020 Earlier Data: Blog 4/5/15 |
Trade | Jan-Apr 2020/Jan-Apr 2019 Exports ∆%: -8.3 Apr 2020 12-month Exports ∆% -28.2 Imports ∆% -22.7 Earlier Data: |
Links to blog comments in Table EUR: 6/14/20 https://cmpassocregulationblog.blogspot.com/2020/06/global-recession-with-output-in-us.html
6/7/20 https://cmpassocregulationblog.blogspot.com/2020/06/creation-of-three-million-private.html
5/31/20 https://cmpassocregulationblog.blogspot.com/2020/05/mediocre-cyclical-united-states_31.html
5/10/20 https://cmpassocregulationblog.blogspot.com/2020/05/fifty-two-million-unemployed-or.html
5/3/20 https://cmpassocregulationblog.blogspot.com/2020/05/mediocre-cyclical-united-states.htmlhttps://cmpassocregulationblog.blogspot.com/2020/04/valuations-of-risk-financial-assets.html
4/5/2020 https://cmpassocregulationblog.blogspot.com/2020/04/lockdown-of-economic-activity-in.html
3/29/2020 https://cmpassocregulationblog.blogspot.com/2020/03/weekly-rise-of-valuations-of-risk.html
3/22/20 https://cmpassocregulationblog.blogspot.com/2020/03/sharp-contraction-of-valuations-of-risk.html
3/8/20 https://cmpassocregulationblog.blogspot.com/2020/03/stress-of-world-financial-markets-fomc.html
3/1/20 https://cmpassocregulationblog.blogspot.com/2020/02/sharp-worldwide-contraction-of.html
2/9/2020 https://cmpassocregulationblog.blogspot.com/2020/02/increasing-valuations-of-risk-financial.html
1/26/20 https://cmpassocregulationblog.blogspot.com/2020/01/declining-valuations-of-risk-financial.html
1/12/20 https://cmpassocregulationblog.blogspot.com/2020/01/increasing-valuations-of-risk-financial.html
12/29/19 https://cmpassocregulationblog.blogspot.com/2019/12/diverging-economic-conditions-and.html
12/15/19 https://cmpassocregulationblog.blogspot.com/2019/12/increase-in-valuations-of-risk_14.html
12/8/19 https://cmpassocregulationblog.blogspot.com/2019/12/increase-in-valuations-of-risk.html
1/24/19 https://cmpassocregulationblog.blogspot.com/2019/11/oscillating-risk-financial-assets-world.html
11/10/19 https://cmpassocregulationblog.blogspot.com/2019/11/increasing-valuations-of-risk-financial.html
11/3/19 https://cmpassocregulationblog.blogspot.com/2019/11/decrease-of-fomc-policy-rate-monetary.html
10/20/19 https://cmpassocregulationblog.blogspot.com/2019/10/dollar-depreciation-fluctuating.html
10/6/19 https://cmpassocregulationblog.blogspot.com/2019/10/volatility-of-valuations-of-risk.html
9/22/19 https://cmpassocregulationblog.blogspot.com/2019/09/uncertain-fomc-outlook-of-monetary.html
9/15/19 https://cmpassocregulationblog.blogspot.com/2019/09/competitive-exchange-rate-and-interest.html
9/8/19 https://cmpassocregulationblog.blogspot.com/2019/09/increase-in-valuations-of-risk.html
8/25/19 https://cmpassocregulationblog.blogspot.com/2019/08/contraction-of-valuations-of-risk.html
8/4/19 https://cmpassocregulationblog.blogspot.com/2019/08/dollar-appreciation-contraction-of.html
7/21/2019 https://cmpassocregulationblog.blogspot.com/2019/07/global-manufacturing-stress-world.html
7/7/19 https://cmpassocregulationblog.blogspot.com/2019/07/twenty-million-unemployed-or.html
6/9/19 https://cmpassocregulationblog.blogspot.com/2019/06/increase-of-valuations-of-risk.html
5/26/19 https://cmpassocregulationblog.blogspot.com/2019/05/contraction-of-risk-financial-assets.html
3/10/19 https://cmpassocregulationblog.blogspot.com/2019/03/dollar-revaluation-twenty-one-million.html
12/16/18 https://cmpassocregulationblog.blogspot.com/2018/12/slowing-world-economic-growth-and.html
9/16/18 https://cmpassocregulationblog.blogspot.com/2018/09/recovery-without-hiring-in-lost.html
8/19/18 https://cmpassocregulationblog.blogspot.com/2018/08/world-inflation-waves-lost-economic.html
6/10/18 https://cmpassocregulationblog.blogspot.com/2018/06/twenty-one-million-unemployed-or.html
5/20/18 https://cmpassocregulationblog.blogspot.com/2018/05/dollar-revaluation-united-states_24.html
3/11/18 https://cmpassocregulationblog.blogspot.com/2018/03/twenty-three-million-unemployed-or.html
2/18/18 https://cmpassocregulationblog.blogspot.com/2018/02/united-states-inflation-trend-or.html
12/10/17 https://cmpassocregulationblog.blogspot.com/2017/12/twenty-one-million-unemployed-or.html
11/26/17 https://cmpassocregulationblog.blogspot.com/2017/11/the-lost-economic-cycle-of-global_25.html
9/10/17 https://cmpassocregulationblog.blogspot.com/2017/09/twenty-two-million-unemployed-or.html
8/20/17 https://cmpassocregulationblog.blogspot.com/2017/08/fluctuating-valuations-of-risk.html
6/11/17 https://cmpassocregulationblog.blogspot.com/2017/06/flattening-us-treasury-yield-curve.html
5/21/17 https://cmpassocregulationblog.blogspot.com/2017/05/dollar-devaluation-world-inflation.html
3/12/17 https://cmpassocregulationblog.blogspot.com/2017/03/increasing-interest-rates-twenty-four.html
2/26/17 https://cmpassocregulationblog.blogspot.com/2017/02/united-states-commercial-banks-assets.html
12/11/16 http://cmpassocregulationblog.blogspot.com/2016/12/rising-values-of-risk-financial-assets.html
11/20/16 http://cmpassocregulationblog.blogspot.com/2016/11/interest-rate-increase-could-well.html
11/13/16 http://cmpassocregulationblog.blogspot.com/2016/11/dollar-revaluation-and-valuations-of.html
11/6/16 http://cmpassocregulationblog.blogspot.com/2016/11/the-case-for-increase-in-federal-funds.html
9/11/16 http://cmpassocregulationblog.blogspot.com/2016/09/interest-rate-uncertainty-and-valuation.html
8/14/16 http://cmpassocregulationblog.blogspot.com/2016/08/rising-valuations-of-risk-financial.html
8/7/16 http://cmpassocregulationblog.blogspot.com/2016/08/global-competitive-easing-or.html
6/12/16 http://cmpassocregulationblog.blogspot.com/2016/06/considerable-uncertainty-about-economic.html
5/15/16 http://cmpassocregulationblog.blogspot.com/2016/05/recovery-without-hiring-ten-million.html
5/1/16 http://cmpassocregulationblog.blogspot.com/2016/05/economic-activity-appears-to-have.html
3/13/16 http://cmpassocregulationblog.blogspot.com/2016/03/monetary-policy-and-fluctuations-of_13.html
3/6/16 http://cmpassocregulationblog.blogspot.com/2016/03/twenty-five-million-unemployed-or.html
2/14/16 http://cmpassocregulationblog.blogspot.com/2016/02/subdued-foreign-growth-and-dollar.html
12/13/15 http://cmpassocregulationblog.blogspot.com/2015/12/liftoff-of-interest-rates-with-volatile_17.html
4/19/2015 http://cmpassocregulationblog.blogspot.com/2015/04/global-portfolio-reallocations-squeeze.html
4/5/15 http://cmpassocregulationblog.blogspot.com/2015/04/volatility-of-valuations-of-financial.html
3/15/15 http://cmpassocregulationblog.blogspot.com/2015/03/global-exchange-rate-struggle-recovery.html
VE Germany. Table VE-DE provides annual growth rates of the German economy from 1971 to 2019, price adjusted chain-linked and price and calendar-adjusted chain-linked (https://www.destatis.de/EN/Press/2020/02/PE20_056_811.html). Germany’s GDP fell 5.7 percent in 2009 after growing below trend at 1.0 percent in 2008. Recovery had been robust in contrast with other advanced economies. The German economy grew at 4.2 percent in 2010, 3.9 percent in 2011 and 0.4 percent in 2012. Growth stabilized to 0.4 percent in 2013, increasing to 2.2 percent in 2014. The German economy grew at 1.7 percent in 2015 and grew at 2.2 percent in 2016. Germany’s GDP increased 2.5 percent in 2017 and increased 1.5 percent in 2018. The German economy grew at 0.6 percent in 2019.
The Federal Statistical Agency of Germany analyzes the fall and recovery of the German economy in its earlier website (http://www.destatis.de/jetspeed/portal/cms/Sites/destatis/Internet/EN/Content/Statistics/VolkswirtschaftlicheGesamtrechnungen/Inlandsprodukt/Aktuell,templateId=renderPrint.psml):
“The German economy again grew strongly in 2011. The price-adjusted gross domestic product (GDP) increased by 3.0% compared with the previous year. Accordingly, the catching-up process of the German economy continued during the second year after the economic crisis. In the course of 2011, the price-adjusted GDP again exceeded its pre-crisis level. The economic recovery occurred mainly in the first half of 2011. In 2009, Germany experienced the most serious post-war recession, when GDP suffered a historic decline of 5.1%. The year 2010 was characterised by a rapid economic recovery (+3.7%).”
Table VE-DE, Germany, GDP ∆% on Prior Year
Price Adjusted Chain-Linked | Price- and Calendar-Adjusted Chain Linked | |
Average ∆% 1991-2017 | 1.4 | |
Average ∆% 1991-2018 | 1.4 | |
Average ∆% 1991-1999 | 1.4 | |
Average ∆% 2000-2007 | 1.3 | |
Average ∆% 2003-2007 | 2.2 | |
Average ∆% 2007-2018 | 1.3 | |
Average ∆% 2009-2018 | 2.1 | |
2019 | 0.6 | 0.6 |
2018 | 1.5 | 1.5 |
2017 | 2.5 | 2.8 |
2016 | 2.2 | 2.1 |
2015 | 1.7 | 1.5 |
2014 | 2.2 | 2.2 |
2013 | 0.4 | 0.5 |
2012 | 0.4 | 0.6 |
2011 | 3.9 | 4.0 |
2010 | 4.2 | 4.0 |
2009 | -5.7 | -5.6 |
2008 | 1.0 | 0.7 |
2007 | 3.0 | 3.1 |
2006 | 3.8 | 4.0 |
2005 | 0.7 | 0.9 |
2004 | 1.2 | 0.7 |
2003 | -0.7 | -0.7 |
2002 | -0.2 | -0.2 |
2001 | 1.7 | 1.8 |
2000 | 2.9 | 3.1 |
1999 | 1.9 | 1.7 |
1998 | 2.0 | 1.8 |
1997 | 1.8 | 1.9 |
1996 | 0.8 | 0.8 |
1995 | 1.5 | 1.6 |
1994 | 2.4 | 2.5 |
1993 | -1.0 | -1.0 |
1992 | 1.9 | 1.5 |
1991 | 5.1 | 5.2 |
1990 | 5.3 | 5.5 |
1989 | 3.9 | 4.0 |
1988 | 3.7 | 3.4 |
1987 | 1.4 | 1.3 |
1986 | 2.3 | 2.3 |
1985 | 2.3 | 2.6 |
1984 | 2.8 | 2.9 |
1983 | 1.6 | 1.5 |
1982 | -0.4 | -0.5 |
1981 | 0.5 | 0.6 |
1980 | 1.4 | 1.3 |
1979 | 4.2 | 4.3 |
1978 | 3.0 | 3.1 |
1977 | 3.3 | 3.5 |
1976 | 4.9 | 4.5 |
1975 | -0.9 | -0.9 |
1974 | 0.9 | 1.0 |
1973 | 4.8 | 5.0 |
1972 | 4.3 | 4.3 |
1971 | 3.1 | 3.0 |
1970 | NA | NA |
Source: Statistisches Bundesamt Deutschland (Destatis)
https://www.destatis.de/EN/Press/2020/05/PE20_180_811.html
The Flash Germany Composite Output Index of the IHS Markit Flash Germany PMI®, combining manufacturing and services, increased from 17.4 in Apr to 31.4 in May. The index of manufacturing output reached 31.5 in May, increasing from 19.7 in Apr, while the index of services increased to 31.4 in May from 16.2 in Apr. The overall Flash Germany Manufacturing PMI® increased from 34.5 in Apr to 36.8 in May (https://www.markiteconomics.com/Public/Home/PressRelease/91ed5ea435694787b099736deb961a99). New orders decreased and new export orders decreased. Phil Smith, Principal Economist at IHS Markit, finds sharply decreasing manufacturing of Germany with contracting services (https://www.markiteconomics.com/Public/Home/PressRelease/91ed5ea435694787b099736deb961a99). The IHS Markit Germany Composite Output Index of the IHS Markit Germany Services PMI®, combining manufacturing and services with close association with Germany’s GDP, increased from 17.4 in Apr to 32.3 in May (https://www.markiteconomics.com/Public/Home/PressRelease/a112e4a397914b1199b8495d5744fde9). Phil Smith, Principal Economist at IHS Markit, finds contracting conditions of Germany (https://www.markiteconomics.com/Public/Home/PressRelease/a112e4a397914b1199b8495d5744fde9). The Germany Services Business Activity Index increased from 16.2 in Apr to 32.6 in May (https://www.markiteconomics.com/Public/Home/PressRelease/a112e4a397914b1199b8495d5744fde9). The IHS Markit/BME Germany Purchasing Managers’ Index® (PMI®), showing close association with Germany’s manufacturing conditions, increased from 34.5 in Apr to 36.6 in May (https://www.markiteconomics.com/Public/Home/PressRelease/efe3540af88f402baebad6cb8f366d72). New export orders decreased. Phil Smith, Principal Economist at IHS Markit, finds deteriorating conditions (https://www.markiteconomics.com/Public/Home/PressRelease/efe3540af88f402baebad6cb8f366d72). Table DE provides the country data table for Germany.
Table DE, Germany, Economic Indicators
GDP | IQ2020 -2.2 ∆%; IQ2020/IQ2019 NCSA ∆% minus 1.9 CA minus 2.3 2016/2015: 2.2 CA 2.1 2017/2016: 2.5 CA 2.8 2018/2017: 1.5 CA 1.5 2019/2018: 0.6 CA 0.6 GDP ∆% 1970-2019 Blog 8/26/12 5/27/12 11/25/12 2/24/13 5/19/13 5/26/13 8/18/13 8/25/13 11/17/13 11/24/13 1/26/14 2/16/14 3/2/14 5/18/14 5/25/14 8/17/14 9/7/14 11/16/14 11/30/14 2/15/15 3/1/15 5/17/15 5/24/15 8/16/15 8/30/15 11/22/15 11/29/15 2/14/16 2/28/16 5/15/16 5/29/16 8/14/16 8/28/16 11/20/16 11/27/16 2/19/17 02/26/17 05/14/17 5/28/17 8/20/17 8/27/17 11/26/17 2/18/18 2/25/18 5/20/18 5/27/18 8/19/18 9/2/18 11/18/18 11/25/18 4/14/19 5/26/19 9/1/19 12/1/19 3/8/20 5/31/20 |
Consumer Price Index | Apr month NSA ∆%: 0.4 |
Producer Price Index | Apr month -0.6 12 months minus 1.5 |
Industrial Production | MFG Production Apr month CSA ∆%: -22.0 Earlier Data: |
Machine Orders | MFG Apr month ∆%: -25.8 Earlier Data: |
Retail Sales | Mar Month ∆% -5.6 12-Month ∆% -2.8 Earlier Data: Blog 4/5/15 |
Employment Report | Unemployment Rate SA Apr 3.5% |
Trade Balance | Exports Apr 12-month NSA ∆%: -31.1 Earlier Data: Blog 4/12/15 |
Links to blog comments in Table DE: 6/7/20 https://cmpassocregulationblog.blogspot.com/2020/06/creation-of-three-million-private.html
5/31/20 https://cmpassocregulationblog.blogspot.com/2020/05/mediocre-cyclical-united-states_31.html
5/10/20 https://cmpassocregulationblog.blogspot.com/2020/05/fifty-two-million-unemployed-or.html
5/3/20 https://cmpassocregulationblog.blogspot.com/2020/05/mediocre-cyclical-united-states.html
4/26/20
https://cmpassocregulationblog.blogspot.com/2020/04/valuations-of-risk-financial-assets.html
4/5/2020 https://cmpassocregulationblog.blogspot.com/2020/04/lockdown-of-economic-activity-in.html
3/29/2020 https://cmpassocregulationblog.blogspot.com/2020/03/weekly-rise-of-valuations-of-risk.html
3/8/20 https://cmpassocregulationblog.blogspot.com/2020/03/stress-of-world-financial-markets-fomc.html
3/1/20 https://cmpassocregulationblog.blogspot.com/2020/02/sharp-worldwide-contraction-of.html
2/9/2020 https://cmpassocregulationblog.blogspot.com/2020/02/increasing-valuations-of-risk-financial.html
1/12/20 https://cmpassocregulationblog.blogspot.com/2020/01/increasing-valuations-of-risk-financial.html
12/29/19 https://cmpassocregulationblog.blogspot.com/2019/12/diverging-economic-conditions-and.html
12/15/19 https://cmpassocregulationblog.blogspot.com/2019/12/increase-in-valuations-of-risk_14.html
12/8/19 https://cmpassocregulationblog.blogspot.com/2019/12/increase-in-valuations-of-risk.html
12/1/19 https://cmpassocregulationblog.blogspot.com/2019/11/fluctuating-valuations-of-risk.html
11/24/19 https://cmpassocregulationblog.blogspot.com/2019/11/oscillating-risk-financial-assets-world.html
11/3/19 https://cmpassocregulationblog.blogspot.com/2019/11/decrease-of-fomc-policy-rate-monetary.html
10/27/19 https://cmpassocregulationblog.blogspot.com/2019/10/increasing-valuations-of-risk-financial_26.html
10/20/19 https://cmpassocregulationblog.blogspot.com/2019/10/dollar-depreciation-fluctuating.html
10/6/19 https://cmpassocregulationblog.blogspot.com/2019/10/volatility-of-valuations-of-risk.html
9/29/19 https://cmpassocregulationblog.blogspot.com/2019/09/dollar-appreciation-decreasing.html
9/15/19 https://cmpassocregulationblog.blogspot.com/2019/09/competitive-exchange-rate-and-interest.html
9/8/19 https://cmpassocregulationblog.blogspot.com/2019/09/increase-in-valuations-of-risk.html
9/1/19 https://cmpassocregulationblog.blogspot.com/2019/08/revaluation-of-us-dollar-falling-yields.html
8/25/19 https://cmpassocregulationblog.blogspot.com/2019/08/contraction-of-valuations-of-risk.html
8/18/19 https://cmpassocregulationblog.blogspot.com/2019/08/global-decline-of-yields-of-government.html
8/4/19 https://cmpassocregulationblog.blogspot.com/2019/08/dollar-appreciation-contraction-of.html
7/14/19 https://cmpassocregulationblog.blogspot.com/2019/07/fomc-uncertain-outlook-frank-h-knights.html
7/7/19 https://cmpassocregulationblog.blogspot.com/2019/07/twenty-million-unemployed-or.html
6/2/19 https://cmpassocregulationblog.blogspot.com/2019/06/contraction-of-risk-financial-assets.html
5/26/19 https://cmpassocregulationblog.blogspot.com/2019/05/contraction-of-risk-financial-assets.html
5/5/19 https://cmpassocregulationblog.blogspot.com/2019/05/fluctuating-valuations-of-risk.html
4/14/19 https://cmpassocregulationblog.blogspot.com/2019/04/recovery-without-hiring-labor.html
1/20/19 https://cmpassocregulationblog.blogspot.com/2019/01/world-inflation-waves-world-financial_24.html
11/25/18 https://cmpassocregulationblog.blogspot.com/2018/11/weaker-world-economic-growth-with.html
11/18/18 https://cmpassocregulationblog.blogspot.com/2018/11/weakening-gdp-growth-in-major-economies.html
9/2/18 https://cmpassocregulationblog.blogspot.com/2018/09/revision-of-united-states-national.html
8/19/18 https://cmpassocregulationblog.blogspot.com/2018/08/world-inflation-waves-lost-economic.html
5/27/2018 https://cmpassocregulationblog.blogspot.com/2018/05/dollar-strengthening-world-inflation.html
5/20/2018 https://cmpassocregulationblog.blogspot.com/2018/05/dollar-revaluation-united-states_24.html
2/25/18 https://cmpassocregulationblog.blogspot.com/2018/02/world-inflation-waves-united-states.html
2/18/18 https://cmpassocregulationblog.blogspot.com/2018/02/united-states-inflation-trend-or.html
11/26/17 https://cmpassocregulationblog.blogspot.com/2017/11/the-lost-economic-cycle-of-global_25.html
8/27/17 https://cmpassocregulationblog.blogspot.com/2017/08/dollar-devaluation-and-interest-rate.html
5/28/17 https://cmpassocregulationblog.blogspot.com/2017/05/mediocre-cyclical-united-states.html
5/14/17 https://cmpassocregulationblog.blogspot.com/2017/05/recovery-without-hiring-ten-million_14.html
2/26/17 https://cmpassocregulationblog.blogspot.com/2017/02/united-states-commercial-banks-assets.html
02/19/17 https://cmpassocregulationblog.blogspot.com/2017/02/world-inflation-waves-united-states.html
11/27/16 http://cmpassocregulationblog.blogspot.com/2016/11/dollar-revaluation-rising-yields-and.html
11/20/16 http://cmpassocregulationblog.blogspot.com/2016/11/interest-rate-increase-could-well.html
11/13/16 http://cmpassocregulationblog.blogspot.com/2016/11/dollar-revaluation-and-valuations-of.html
11/6/16 http://cmpassocregulationblog.blogspot.com/2016/11/the-case-for-increase-in-federal-funds.html
8/28/16 http://cmpassocregulationblog.blogspot.com/2016/08/and-as-ever-economic-outlook-is.html
8/14/16 http://cmpassocregulationblog.blogspot.com/2016/08/rising-valuations-of-risk-financial.html
5/29/16 http://cmpassocregulationblog.blogspot.com/2016/05/appropriate-for-fed-to-increase.html
5/15/16 http://cmpassocregulationblog.blogspot.com/2016/05/recovery-without-hiring-ten-million.html
2/28/16 http://cmpassocregulationblog.blogspot.com/2016/02/mediocre-cyclical-united-states.html
2/14/16 http://cmpassocregulationblog.blogspot.com/2016/02/subdued-foreign-growth-and-dollar.html
11/29/15 http://cmpassocregulationblog.blogspot.com/2015/11/dollar-revaluation-constraining.html
11/22/15 http://cmpassocregulationblog.blogspot.com/2015/11/interest-rate-liftoff-followed-by.html
08/30/15 http://cmpassocregulationblog.blogspot.com/2015/08/fluctuations-of-global-financial.html
08/16/15 http://cmpassocregulationblog.blogspot.com/2015/08/exchange-rate-and-financial-asset.html
5/24/15 http://cmpassocregulationblog.blogspot.com/2015/05/interest-rate-policy-and-dollar.html
5/17/15 http://cmpassocregulationblog.blogspot.com/2015/05/fluctuating-valuations-of-financial.html
4/12/15 http://cmpassocregulationblog.blogspot.com/2015/04/dollar-revaluation-recovery-without.html
4/5/15 http://cmpassocregulationblog.blogspot.com/2015/04/volatility-of-valuations-of-financial.html
3/1/15 http://cmpassocregulationblog.blogspot.com/2015/03/irrational-exuberance-mediocre-cyclical.html
2/15/15 http://cmpassocregulationblog.blogspot.com/2015/02/g20-monetary-policy-recovery-without.html
11/30/14 http://cmpassocregulationblog.blogspot.com/2014/11/valuations-of-risk-financial-assets.html
11/16/14 http://cmpassocregulationblog.blogspot.com/2014/11/fluctuating-financial-variables.html
9/7/14 http://cmpassocregulationblog.blogspot.com/2014/09/competitive-monetary-policy-and.html
8/17/2014 http://cmpassocregulationblog.blogspot.com/2014/08/weakening-world-economic-growth.html
5/25/14 http://cmpassocregulationblog.blogspot.com/2014/05/united-states-commercial-banks-assets.html
5/18/14 http://cmpassocregulationblog.blogspot.com/2014/05/world-inflation-waves-squeeze-of.html
3/2/14 http://cmpassocregulationblog.blogspot.com/2014/03/financial-risks-slow-cyclical-united.html
2/16/14 http://cmpassocregulationblog.blogspot.com/2014/02/theory-and-reality-of-cyclical-slow.html
1/26/14 http://cmpassocregulationblog.blogspot.com/2014/01/capital-flows-exchange-rates-and.html
11/24/13 http://cmpassocregulationblog.blogspot.com/2013/11/risks-of-zero-interest-rates-world.html
11/17/13 http://cmpassocregulationblog.blogspot.com/2013/11/risks-of-unwinding-monetary-policy.html
8/25/13 http://cmpassocregulationblog.blogspot.com/2013/08/interest-rate-risks-duration-dumping.html
8/18/13 http://cmpassocregulationblog.blogspot.com/2013/08/duration-dumping-and-peaking-valuations.html
VF France. Table VF-FR provides growth rates of GDP of France with the estimates of Institut National de la Statistique et des Études Économiques (INSEE). The long-term rate of GDP growth of France from IVQ1949 to IQ2020 is quite high at 3.0 percent. France’s growth rates were quite high in the four decades of the 1950s, 1960, 1970s and 1980s with an average growth rate of 4.0 percent compounding the average rates in the decades and discounting to one decade. The growth impulse diminished with 2.0 percent in the 1990s and 1.8 percent from 2000 to 2007. The average growth rate from 2000 to 2019, using fourth quarter data, is 1.2 percent because of the sharp impact of the global recession from IVQ2007 to IIQ2009. The average growth rate from 2007 to 2020, using quarterly data, drops to 0.4 percent in the global recession, with output in the US reaching a high in Feb 2020 (https://www.nber.org/cycles.html), in the lockdown of economic activity in the COVID-19 event. Cobet and Wilson (2002) provide estimates of output per hour and unit labor costs in national currency and US dollars for the US, Japan and Germany from 1950 to 2000 (see Pelaez and Pelaez, The Global Recession Risk (2007), 137-44). The average yearly rate of productivity change from 1950 to 2000 was 2.9 percent in the US, 6.3 percent for Japan and 4.7 percent for Germany while unit labor costs in USD increased at 2.6 percent in the US, 4.7 percent in Japan and 4.3 percent in Germany. From 1995 to 2000, output per hour increased at the average yearly rate of 4.6 percent in the US, 3.9 percent in Japan and 2.6 percent in Germany while unit labor costs in US fell at minus 0.7 percent in the US, 4.3 percent in Japan and 7.5 percent in Germany. There was increase in productivity growth in the G7 in Japan and France in the second half of the 1990s but significantly lower than the acceleration of 1.3 percentage points per year in the US. Lucas (2011May) compares growth of the G7 economies (US, UK, Japan, Germany, France, Italy and Canada) and Spain, finding that catch-up growth with earlier rates for the US and UK stalled in the 1970s.
Table VF-FR, France, Average Growth Rates of GDP Fourth Quarter, 1949-2018
Period | Average ∆% |
1949-2019 | 3.0 |
2007-2020****** | 0.4 |
2007-2019***** | 0.9 |
2007-2018**** | 0.9 |
2007-2017*** | 0.8 |
2007-2016** | 0.6 |
2007-2015* | 0.5 |
2007-2014 | 0.4 |
2000-2019 | 1.2 |
2000-2018 | 1.2 |
2000-2017 | 1.2 |
2000-2016 | 1.1 |
2000-2015 | 1.1 |
2000-2014 | 1.1 |
2000-2007 | 1.8 |
1990-1999 | 2.0 |
1980-1989 | 2.7 |
1970-1979 | 3.7 |
1960-1969 | 5.7 |
1950-1959 | 4.2 |
*IVQ2007 to IVQ2015 **IVQ2007 to IVQ2016 ***IVQ2007 to IVQ2017 ****IVQ2007 to IVQ2018 *****IVQ2007 to IVQ2019 ******IVQ2007-IQ2020
Source: Institut National de la Statistique et des Études Économiques
https://www.insee.fr/en/statistiques/4501850
https://www.insee.fr/fr/information/2411675#arbo:montrerbranches=theme312
The IHS Markit Flash France Composite Output Index increased from 11.1 in Apr to 30.5 in May (https://www.markiteconomics.com/Public/Home/PressRelease/585c40f16da84973ac8e77c0420b7d3e). Eliot Kerr, Economist at IHS Markit, finds sharply contracting conditions (https://www.markiteconomics.com/Public/Home/PressRelease/585c40f16da84973ac8e77c0420b7d3e). The IHS Markit France Composite Output Index, combining services and manufacturing with close association with French GDP, increased from 11.1 in Apr to 32.1 in May, indicating contracting activity of the private sector (https://www.markiteconomics.com/Public/Home/PressRelease/e864cc68e61a46a2bee6c2ae4c6319cc). Eliot Kerr, Economist at IHS Markit that compiles the France Services PMI®, finds contracting activity (https://www.markiteconomics.com/Public/Home/PressRelease/e864cc68e61a46a2bee6c2ae4c6319cc). The IHS Markit France Services Activity index increased from 10.2 in Apr to 31.1 in May (https://www.markiteconomics.com/Public/Home/PressRelease/e864cc68e61a46a2bee6c2ae4c6319cc). The IHS Markit France Manufacturing Purchasing Managers’ Index® increased to 40.6 in May from 31.5 in Apr (https://www.markiteconomics.com/Public/Home/PressRelease/626baed43c13446284f36b0ecd12097b). Eliot Kerr, Economist at IHS Markit, finds contractting manufacturing (https://www.markiteconomics.com/Public/Home/PressRelease/626baed43c13446284f36b0ecd12097b). Table FR provides the country data table for France.
Table FR, France, Economic Indicators
CPI | May month ∆% 0.2 |
PPI | Apr month ∆%: -2.9 Apr 12 months ∆%: -4.7 Blog 6/7/20 |
GDP Growth | IQ2020/IVQ2019 ∆%: -5.3 |
Industrial Production | Manufacturing Mar -18.2 Quarter ∆%: -6.1 YOY -7.8 Earlier Data: |
Consumer Spending | Engineered Goods Earlier Data: |
Employment | Unemployment Rate: IQ2020 7.6% |
Trade Balance | Apr Exports ∆%: month -32.4 12 months -43.9 Imports ∆%: month -25.0 12 months -39.6 Earlier Data: Blog 4/12/15 |
Confidence Indicators | Historical average 100 Feb Mfg Business Climate 102 Earlier Data: Blog 3/29/15 |
Links to blog comments in Table FR: 6/14/20 https://cmpassocregulationblog.blogspot.com/2020/06/global-recession-with-output-in-us.html
6/7/20 https://cmpassocregulationblog.blogspot.com/2020/06/creation-of-three-million-private.html
5/24/2020 https://cmpassocregulationblog.blogspot.com/2020/05/recovery-without-hiring-twenty-million.html
4/26/20 https://cmpassocregulationblog.blogspot.com/2020/04/valuations-of-risk-financial-assets.html
4/5/2020 https://cmpassocregulationblog.blogspot.com/2020/04/lockdown-of-economic-activity-in.html
3/15/20 https://cmpassocregulationblog.blogspot.com/2020/03/financial-markets-stress-in.html
3/8/20 https://cmpassocregulationblog.blogspot.com/2020/03/stress-of-world-financial-markets-fomc.html
2/23/20 https://cmpassocregulationblog.blogspot.com/2020/02/declining-valuations-of-risk-financial.html
2/16/20 https://cmpassocregulationblog.blogspot.com/2020/02/recovery-without-hiring-in-lost.html
2/9/2020 https://cmpassocregulationblog.blogspot.com/2020/02/increasing-valuations-of-risk-financial.html
1/19/20 https://cmpassocregulationblog.blogspot.com/2020/01/rising-valuations-of-risk-financial.html
12/29/19 https://cmpassocregulationblog.blogspot.com/2019/12/diverging-economic-conditions-and.html
12/15/19 https://cmpassocregulationblog.blogspot.com/2019/12/increase-in-valuations-of-risk_14.html
12/1/19 https://cmpassocregulationblog.blogspot.com/2019/11/fluctuating-valuations-of-risk.html
11/17/19 https://cmpassocregulationblog.blogspot.com/2019/11/increasing-valuations-of-risk-financial_16.html
11/3/19 https://cmpassocregulationblog.blogspot.com/2019/11/decrease-of-fomc-policy-rate-monetary.html
10/27/19 https://cmpassocregulationblog.blogspot.com/2019/10/increasing-valuations-of-risk-financial_26.html
10/20/19 https://cmpassocregulationblog.blogspot.com/2019/10/dollar-depreciation-fluctuating.html
9/29/19 https://cmpassocregulationblog.blogspot.com/2019/09/dollar-appreciation-decreasing.html
9/15/19 https://cmpassocregulationblog.blogspot.com/2019/09/competitive-exchange-rate-and-interest.html
9/8/19 https://cmpassocregulationblog.blogspot.com/2019/09/increase-in-valuations-of-risk.html
8/18/19 https://cmpassocregulationblog.blogspot.com/2019/08/global-decline-of-yields-of-government.html
8/11/19 https://cmpassocregulationblog.blogspot.com/2019/08/competitive-exchange-rate-policies.html
7/28/19 https://cmpassocregulationblog.blogspot.com/2019/07/dollar-appreciation-in-anticipations-of.html
7/14/19 https://cmpassocregulationblog.blogspot.com/2019/07/fomc-uncertain-outlook-frank-h-knights.html
6/30/2019 https://cmpassocregulationblog.blogspot.com/2019/06/mediocre-cyclical-united-states.html
6/2/19 https://cmpassocregulationblog.blogspot.com/2019/06/contraction-of-risk-financial-assets.html
5/5/19 https://cmpassocregulationblog.blogspot.com/2019/05/fluctuating-valuations-of-risk.html
3/31/19 https://cmpassocregulationblog.blogspot.com/2019/03/inverted-yield-curve-of-treasury_30.html
12/30/18 https://cmpassocregulationblog.blogspot.com/2018/12/mediocre-cyclical-united-states.html
12/9/18 https://cmpassocregulationblog.blogspot.com/2018/12/fluctuation-of-valuations-of-risk.html
11/11/18 https://cmpassocregulationblog.blogspot.com/2018/11/oscillation-of-valuations-of-risk.html
9/2/18 https://cmpassocregulationblog.blogspot.com/2018/09/revision-of-united-states-national.html
8/19/18 https://cmpassocregulationblog.blogspot.com/2018/08/world-inflation-waves-lost-economic.html
7/29/18 https://cmpassocregulationblog.blogspot.com/2018/07/revision-of-united-states-national.html
6/24/18 https://cmpassocregulationblog.blogspot.com/2018/06/world-inflation-waves-united-states.html
6/3/18 https://cmpassocregulationblog.blogspot.com/2018/06/stronger-dollar-mediocre-cyclical.html
5/6/2018 https://cmpassocregulationblog.blogspot.com/2018/05/twenty-one-million-unemployed-or.html
04/01/18 https://cmpassocregulationblog.blogspot.com/2018/03/mediocre-cyclical-united-states_31.html
3/4/18 https://cmpassocregulationblog.blogspot.com/2018/03/mediocre-cyclical-united-states.html
2/11/18 https://cmpassocregulationblog.blogspot.com/2018/02/collateral-effects-of-unwinding.html
12/31/17 https://cmpassocregulationblog.blogspot.com/2017/12/dollar-devaluation-cyclically.html
12/10/17 https://cmpassocregulationblog.blogspot.com/2017/12/twenty-one-million-unemployed-or.html
11/26/17 https://cmpassocregulationblog.blogspot.com/2017/11/the-lost-economic-cycle-of-global_25.html
11/12/17 https://cmpassocregulationblog.blogspot.com/2017/11/recovery-without-hiring-ten-million.html
9/3/17 https://cmpassocregulationblog.blogspot.com/2017/09/mediocre-cyclical-united-states.html
8/20/17 https://cmpassocregulationblog.blogspot.com/2017/08/fluctuating-valuations-of-risk.html
6/25/17 https://cmpassocregulationblog.blogspot.com/2017/06/united-states-commercial-banks-united.html
6/4/17 https://cmpassocregulationblog.blogspot.com/2017/06/twenty-two-million-unemployed-or.html
5/7/17 https://cmpassocregulationblog.blogspot.com/2017/05/twenty-two-million-unemployed-or.html
3/26/17 https://cmpassocregulationblog.blogspot.com/2017/03/recovery-without-hiring-ten-million.html
3/5/17 https://cmpassocregulationblog.blogspot.com/2017/03/rising-valuations-of-risk-financial.html
2/12/17 https://cmpassocregulationblog.blogspot.com/2017/02/recovery-without-hiring-ten-million.html
1/1/17 http://cmpassocregulationblog.blogspot.com/2017/01/rules-versus-discretionary-authorities.html
12/4/16 http://cmpassocregulationblog.blogspot.com/2016/12/rising-yields-and-dollar-revaluation.html
10/30/16 http://cmpassocregulationblog.blogspot.com/2016/10/mediocre-cyclical-united-states_30.html
9/25/16 http://cmpassocregulationblog.blogspot.com/2016/09/the-economic-outlook-is-inherently.html
9/4/16 http://cmpassocregulationblog.blogspot.com/2016/09/interest-rates-and-valuations-of-risk.html
8/7/16 http://cmpassocregulationblog.blogspot.com/2016/08/global-competitive-easing-or.html
6/26/16 http://cmpassocregulationblog.blogspot.com/2016/06/of-course-considerable-uncertainty.html
6/5/16 http://cmpassocregulationblog.blogspot.com/2016/06/financial-turbulence-twenty-four.html
5/1/16 http://cmpassocregulationblog.blogspot.com/2016/05/economic-activity-appears-to-have.html
3/27/16 http://cmpassocregulationblog.blogspot.com/2016/03/contraction-of-united-states-corporate.html
2/28/16 http://cmpassocregulationblog.blogspot.com/2016/02/mediocre-cyclical-united-states.html
1/31/16 http://cmpassocregulationblog.blogspot.com/2016/01/closely-monitoring-global-economic-and.html
12/27/15 http://cmpassocregulationblog.blogspot.com/2015/12/dollar-revaluation-and-decreasing.html
11/15/15 http://cmpassocregulationblog.blogspot.com/2015/11/interest-rate-policy-conundrum-recovery.html
9/27/15 http://cmpassocregulationblog.blogspot.com/2015/09/monetary-policy-designed-on-measurable.html
08/16/15 http://cmpassocregulationblog.blogspot.com/2015/08/exchange-rate-and-financial-asset.html
6/28/2015 http://cmpassocregulationblog.blogspot.com/2015/06/international-valuations-of-financial.html
5/17/15 http://cmpassocregulationblog.blogspot.com/2015/05/fluctuating-valuations-of-financial.html
4/12/15 http://cmpassocregulationblog.blogspot.com/2015/04/dollar-revaluation-recovery-without.html
4/5/15 http://cmpassocregulationblog.blogspot.com/2015/04/volatility-of-valuations-of-financial.html
3/29/15 http://cmpassocregulationblog.blogspot.com/2015/03/dollar-revaluation-and-financial-risk.html
2/15/15 http://cmpassocregulationblog.blogspot.com/2015/02/g20-monetary-policy-recovery-without.html
12/28/14 http://cmpassocregulationblog.blogspot.com/2014/12/valuations-of-risk-financial-assets.html
11/16/14 http://cmpassocregulationblog.blogspot.com/2014/11/fluctuating-financial-variables.html
9/28/14 http://cmpassocregulationblog.blogspot.com/2014/09/financial-volatility-mediocre-cyclical.html
8/17/2014 http://cmpassocregulationblog.blogspot.com/2014/08/weakening-world-economic-growth.html
6/29/14 http://cmpassocregulationblog.blogspot.com/2014/06/financial-indecision-mediocre-cyclical.html
5/18/14 http://cmpassocregulationblog.blogspot.com/2014/05/world-inflation-waves-squeeze-of.html
4/6/14 http://cmpassocregulationblog.blogspot.com/2014/04/interest-rate-risks-twenty-eight.html
2/16/14 http://cmpassocregulationblog.blogspot.com/2014/02/theory-and-reality-of-cyclical-slow.html
12/29/13 http://cmpassocregulationblog.blogspot.com/2013/12/collapse-of-united-states-dynamism-of.html
11/17/13 http://cmpassocregulationblog.blogspot.com/2013/11/risks-of-unwinding-monetary-policy.html
9/29/13 http://cmpassocregulationblog.blogspot.com/2013/09/mediocre-and-decelerating-united-states.html
6/30/13 http://cmpassocregulationblog.blogspot.com/2013/06/tapering-quantitative-easing-policy-and.html
5/19/13 http://cmpassocregulationblog.blogspot.com/2013/05/word-inflation-waves-squeeze-of.html
VG Italy. Table VG-IT provides revised percentage changes of GDP in Italy of quarter on prior quarter and quarter on same quarter a year earlier. Italy’s GDP contracted 5.3 percent in IQ2020 and contracted 5.4 percent relative to a year earlier in the global recession of the lockdown of economic activity in the COVID-19 event. In IVQ2019, the GDP of Italy decreased 0.2 percent and increased 0.1 percent relative to a year earlier. Italy’s GDP changed 0.0 percent in IIIQ2019 and increased 0.5 percent relative to a year earlier. In IIQ2019, Italy’s GDP increased 0.1 percent and increased 0.4 percent relative to a year earlier. Italy’s GDP increased 0.2 percent in IQ2019 and increased 0.3 percent relative to a year earlier. In IVQ2018, the GDP of Italy increased 0.2 percent and increased 0.1 percent relative to a year earlier. Italy’s GDP decreased 0.1 percent in IIIQ2018 and increased 0.4 percent relative to a year earlier. In IIQ2018, the GDP of Italy changed 0.0 percent and increased 0.9 percent relative to a year earlier. Italy’s GDP changed 0.0 percent in IQ2018 and increased 1.3 percent relative to a year earlier. In IVQ2017, the GDP of Italy increased 0.5 percent and increased 1.9 percent relative to a year earlier. Italy’s GDP increased 0.4 percent in IIIQ2017 and increased 1.6 percent relative to a year earlier. In IIQ2017, the GDP of Italy increased 0.4 percent and increased 1.8 percent relative to a year earlier. Italy’s GDP increased 0.6 percent in IQ2017 and increased 1.6 percent relative to a year earlier. In IVQ2016, the GDP of Italy increased 0.3 percent and increased 1.4 percent relative to a year earlier. Italy’s GDP increased 0.5 percent in IIIQ2016 and increased 1.6 percent relative to a year earlier. In IIQ2016, GDP increased 0.2 percent and increased 1.2 percent relative to a year earlier. GDP increased 0.3 percent in IQ2016 and increased 1.5 percent relative to a year earlier. GDP increased 0.5 percent in IVQ2015 and increased 1.3 percent relative to a year earlier. In IIIQ2015, GDP increased 0.2 percent and increased 0.6 percent relative to a year earlier. GDP increased 0.4 percent in IIQ2015 and 0.5 percent relative to a year earlier. GDP increased 0.2 percent in IQ2015 and increased 0.1 percent relative to a year earlier. GDP decreased 0.2 percent in IVQ2014 and changed 0.0 percent relative to a year earlier. GDP increased 0.1 percent in IIIQ2014 and changed 0.0 percent relative to a year earlier. Italy’s GDP changed 0.0 percent in IIQ2014 and increased 0.1 percent relative to a year earlier. The GDP of Italy increased 0.1 percent in IQ2014 and increased 0.1 percent relative to a year earlier. Italy’s GDP decreased 0.2 percent in IVQ2013 and fell 0.9 percent relative to a year earlier. The GDP of Italy increased 0.2 percent in IIIQ2013 and fell 1.5 percent relative to a year earlier. Italy’s GDP changed 0.0 percent in IIQ2013 and fell 2.2 percent relative to a year earlier. Italy’s GDP fell 0.8 percent in IQ2013 and declined 2.9 percent relative to IQ2013. GDP had been growing during six consecutive quarters but at very low rates from IQ2010 to IIQ2011. Italy’s GDP fell in seven consecutive quarters from IIIQ2011 to IQ2013 at increasingly higher rates of contraction from 0.5 percent in IIIQ2011 to 0.9 percent in IVQ2011, 1.1 percent in IQ2012, 0.8 percent in IIQ2012 and 0.5 percent in IIIQ2012. The pace of decline accelerated to minus 0.8 percent in IVQ2012 and minus 0.8 percent in IQ2013. GDP contracted cumulatively 5.3 percent in seven consecutive quarterly contractions from IIIQ2011 to IQ2013 at the annual equivalent rate of minus 3.1 percent. The year-on-year rate has fallen from 2.2 percent in IVQ2010 to minus 3.2 percent in IVQ2012, minus 2.9 percent in IQ2013, minus 2.2 percent in IIQ2013 and minus 1.5 percent in IIIQ2013. GDP fell 0.9 percent in IVQ2013 relative to a year earlier. GDP increased 0.1 percent in IQ2014 relative to a year earlier and increased 0.1 percent in IIQ2014 relative to a year earlier. GDP changed 0.0 percent in IIIQ2014 relative to a year earlier and changed 0.0 percent in IVQ2014 relative to a year earlier. GDP increased 0.1 percent in IQ2015 relative to a year earlier and increased 0.5 percent in IIQ2015 relative to a year earlier. GDP increased 0.6 percent in IIIQ2015 relative to a year earlier and increased 1.3 percent in IVQ2015 relative to a year earlier. GDP increased 1.5 percent in IQ2016 relative to a year earlier and increased 1.2 percent in IIQ2016 relative to a year earlier. GDP increased 1.6 percent in IIIQ2016 relative to a year earlier and increased 1.4 percent in IVQ2016 relative to a year earlier. GDP increased 1.6 percent in IQ2017 relative to a year earlier and increased 1.8 percent in IIQ2017 relative to a year earlier. GDP increased 1.6 percent in IIIQ2017 relative to a year earlier and increased 1.9 percent in IVQ2017 relative to a year earlier. GDP increased 1.3 percent in IQ2018 relative to a year earlier and increased 0.9 percent in IIQ2018 relative to a year earlier. GDP increased 0.4 percent in IIIQ2018 relative to a year earlier and increased 0.1 percent in IVQ2018 relative to a year earlier. GDP increased 0.3 percent in IQ2019 relative to a year earlier and increased 0.4 percent in IIQ2019 relative to a year earlier. GDP increased 0.5 percent in IIIIQ2019 relative to a year earlier and increased 0.1 percent in IVQ2019 relative to a year earlier. GDP contracted 5.4 percent in IQ2020 relative to a year earlier. Using seasonally and calendar adjusted chained volumes in the dataset of EUROSTAT (https://ec.europa.eu/eurostat/), the GDP of Italy in IVQ2019 of €407,308.2 million (https://www.istat.it/it/archivio/243606) is lower by 10.0 percent relative to €452,802.5 million in IQ2008 (https://ec.europa.eu/eurostat/). Using seasonally and calendar adjusted chained volumes in the dataset of EUROSTAT (https://ec.europa.eu/eurostat/), the GDP of Italy increased from €392,018.4 million in IQ1998 to €452,802.5 million in IQ2008 at the annual equivalent rate of 1.5 percent. The fiscal adjustment of Italy is significantly more difficult with the economy not growing especially on the prospects of increasing government revenue. The strategy is for reforms to improve productivity, facilitating future fiscal consolidation.
Table VG-IT, Italy, GDP ∆%
Quarter ∆% Relative to Preceding Quarter | Quarter ∆% Relative to Same Quarter Year Earlier | |
IQ2020 | -5.3 | -5.4 |
IVQ2019 | -0.2 | 0.1 |
IIIQ2019 | 0.0 | 0.5 |
IIQ2019 | 0.1 | 0.4 |
IQ2019 | 0.2 | 0.3 |
IVQ2018 | 0.2 | 0.1 |
IIIQ2018 | -0.1 | 0.4 |
IIQ2018 | 0.0 | 0.9 |
IQ2018 | 0.0 | 1.3 |
IVQ2017 | 0.5 | 1.9 |
IIIQ2017 | 0.4 | 1.6 |
IIQ2017 | 0.4 | 1.8 |
IQ2017 | 0.6 | 1.6 |
IVQ2016 | 0.3 | 1.4 |
IIIQ2016 | 0.5 | 1.6 |
IIQ2016 | 0.2 | 1.2 |
IQ2016 | 0.3 | 1.5 |
IVQ2015 | 0.5 | 1.3 |
IIIQ2015 | 0.2 | 0.6 |
IIQ2015 | 0.4 | 0.5 |
IQ2015 | 0.2 | 0.1 |
IVQ2014 | -0.2 | 0.0 |
IIIQ2014 | 0.1 | 0.0 |
IIQ2014 | 0.0 | 0.1 |
IQ2014 | 0.1 | 0.1 |
IVQ2013 | -0.2 | -0.9 |
IIIQ2013 | 0.2 | -1.5 |
IIQ2013 | 0.0 | -2.2 |
IQ2013 | -0.8 | -2.9 |
IVQ2012 | -0.8 | -3.2 |
IIIQ2012 | -0.5 | -3.3 |
IIQ2012 | -0.8 | -3.2 |
IQ2012 | -1.1 | -2.3 |
IVQ2011 | -0.9 | -0.9 |
IIIQ2011 | -0.5 | 0.6 |
IIQ2011 | 0.1 | 1.5 |
IQ2011 | 0.3 | 2.2 |
IVQ2010 | 0.6 | 2.2 |
IIIQ2010 | 0.5 | 1.9 |
IIQ2010 | 0.7 | 1.9 |
IQ2010 | 0.3 | 0.8 |
IVQ2009 | 0.3 | -2.3 |
IIIQ2009 | 0.5 | -5.0 |
IIQ2009 | -0.3 | -6.6 |
IQ2009 | -2.8 | -7.2 |
IVQ2008 | -2.5 | -3.5 |
IIIQ2008 | -1.2 | -1.4 |
IIQ2008 | -0.9 | 0.0 |
IQ2008 | 1.0 | 1.0 |
IV2007 | -0.3 | 0.0 |
IIIQ2007 | 0.2 | 1.5 |
IIQ2007 | 0.1 | 1.7 |
IQ2007 | 0.0 | 2.2 |
Source: Istituto Nazionale di Statistica https://www.istat.it/it/archivio/243606
https://ec.europa.eu/eurostat/
The HIS Markit Italy Composite Output Index increased from 10.9 in Apr to 33.9 in May (https://www.markiteconomics.com/Public/Home/PressRelease/b12bb98b84944bd5bc8a22b6d29590c5).The IHS Markit Italy Business Activity Index increased from 10.8 in Apr to 28.9 in May (https://www.markiteconomics.com/Public/Home/PressRelease/b12bb98b84944bd5bc8a22b6d29590c5). Lewis Cooper, Economist at IHS Markit that compiles the Italy Services PMI®, finds contracting conditions (https://www.markiteconomics.com/Public/Home/PressRelease/b12bb98b84944bd5bc8a22b6d29590c5). The IHS Markit Italy Purchasing Managers’ Index® (PMI®), increased from 31.1 in Apr to 45.4 in May (https://www.markiteconomics.com/Public/Home/PressRelease/c719c0c9cee2405d983b4ae3339b1670). New export orders decreased. Lewis Cooper, Economist at HIS Markit that compiles the Italian Manufacturing PMI®, finds contracting manufacturing (https://www.markiteconomics.com/Public/Home/PressRelease/c719c0c9cee2405d983b4ae3339b1670). Table IT provides the country data table for Italy.
Table IT, Italy, Economic Indicators
Consumer Price Index | May month ∆% -0.2 12 months ∆% -0.2 |
Producer Price Index | Apr month ∆%: -3.4 Apr 12-month ∆%: -6.7 Blog 6/7/20 |
GDP Growth | IQ2020/IVQ2019 SA ∆%: minus 5.3 |
Labor Report | Apr 2020 Participation rate 61.9% Employment ratio 57.9% Unemployment rate 6.3% Youth Unemployment 20.3% Blog 6/7/20 |
Industrial Production | Mar month ∆%: -28.4 Earlier Data: |
Retail Sales | Apr month ∆%: -10.5 Feb 12-month ∆%: -26.3 Earlier Data: Blog 4/26/15 |
Business Confidence | Mfg May 71.2, Jan 99.6 Construction May 108.4 Jan 142.7 Earlier Data: Blog 4/5/15 |
Trade Balance | Balance Mar SA €5348 million Earlier Data: |
Links to blog comments in Table IT: 6/14/20 https://cmpassocregulationblog.blogspot.com/2020/06/global-recession-with-output-in-us.html
6/7/20 https://cmpassocregulationblog.blogspot.com/2020/06/creation-of-three-million-private.html
5/24/2020 https://cmpassocregulationblog.blogspot.com/2020/05/recovery-without-hiring-twenty-million.html
5/3/20 https://cmpassocregulationblog.blogspot.com/2020/05/mediocre-cyclical-united-states.html
4/12/20 https://cmpassocregulationblog.blogspot.com/2020/04/united-states-imbalances-of-internal.html
4/5/2020 https://cmpassocregulationblog.blogspot.com/2020/04/lockdown-of-economic-activity-in.html
3/22/20 https://cmpassocregulationblog.blogspot.com/2020/03/sharp-contraction-of-valuations-of-risk.html
3/15/20 https://cmpassocregulationblog.blogspot.com/2020/03/financial-markets-stress-in.html
3/8/20 https://cmpassocregulationblog.blogspot.com/2020/03/stress-of-world-financial-markets-fomc.html
3/1/20 https://cmpassocregulationblog.blogspot.com/2020/02/sharp-worldwide-contraction-of.html
2/9/2020 https://cmpassocregulationblog.blogspot.com/2020/02/increasing-valuations-of-risk-financial.html
2/2/2020 https://cmpassocregulationblog.blogspot.com/2020/02/decreasing-valuations-of-risk-financial.html
1/26/20 https://cmpassocregulationblog.blogspot.com/2020/01/declining-valuations-of-risk-financial.html
1/12/20 https://cmpassocregulationblog.blogspot.com/2020/01/increasing-valuations-of-risk-financial.html
12/29/19 https://cmpassocregulationblog.blogspot.com/2019/12/diverging-economic-conditions-and.html
12/8/19 https://cmpassocregulationblog.blogspot.com/2019/12/increase-in-valuations-of-risk.html
12/1/19 https://cmpassocregulationblog.blogspot.com/2019/11/fluctuating-valuations-of-risk.html
11/17/19 https://cmpassocregulationblog.blogspot.com/2019/11/increasing-valuations-of-risk-financial_16.html
11/3/19 https://cmpassocregulationblog.blogspot.com/2019/11/decrease-of-fomc-policy-rate-monetary.html
10/20/19 https://cmpassocregulationblog.blogspot.com/2019/10/dollar-depreciation-fluctuating.html
10/6/19 https://cmpassocregulationblog.blogspot.com/2019/10/volatility-of-valuations-of-risk.html
9/29/19 https://cmpassocregulationblog.blogspot.com/2019/09/dollar-appreciation-decreasing.html
9/22/19 https://cmpassocregulationblog.blogspot.com/2019/09/uncertain-fomc-outlook-of-monetary.html
9/15/19 https://cmpassocregulationblog.blogspot.com/2019/09/competitive-exchange-rate-and-interest.html
9/8/19 https://cmpassocregulationblog.blogspot.com/2019/09/increase-in-valuations-of-risk.html
8/11/19 https://cmpassocregulationblog.blogspot.com/2019/08/competitive-exchange-rate-policies.html
8/4/19 https://cmpassocregulationblog.blogspot.com/2019/08/dollar-appreciation-contraction-of.html
7/21/2019 https://cmpassocregulationblog.blogspot.com/2019/07/global-manufacturing-stress-world.html
7/7/19 https://cmpassocregulationblog.blogspot.com/2019/07/twenty-million-unemployed-or.html
6/30/2019 https://cmpassocregulationblog.blogspot.com/2019/06/mediocre-cyclical-united-states.html
6/9/19 https://cmpassocregulationblog.blogspot.com/2019/06/increase-of-valuations-of-risk.html
5/26/19 https://cmpassocregulationblog.blogspot.com/2019/05/contraction-of-risk-financial-assets.html
3/10/19 https://cmpassocregulationblog.blogspot.com/2019/03/dollar-revaluation-twenty-one-million.html
12/16/18 https://cmpassocregulationblog.blogspot.com/2018/12/slowing-world-economic-growth-and.html
9/9/18 https://cmpassocregulationblog.blogspot.com/2018/09/twenty-one-million-unemployed-or.html
5/20/2018 https://cmpassocregulationblog.blogspot.com/2018/05/dollar-revaluation-united-states_24.html
3/11/18 https://cmpassocregulationblog.blogspot.com/2018/03/twenty-three-million-unemployed-or.html
2/18/18 https://cmpassocregulationblog.blogspot.com/2018/02/united-states-inflation-trend-or.html
12/10/17 https://cmpassocregulationblog.blogspot.com/2017/12/twenty-one-million-unemployed-or.html
11/26/17 https://cmpassocregulationblog.blogspot.com/2017/11/the-lost-economic-cycle-of-global_25.html
9/3/17 https://cmpassocregulationblog.blogspot.com/2017/09/mediocre-cyclical-united-states.html
8/20/17 https://cmpassocregulationblog.blogspot.com/2017/08/fluctuating-valuations-of-risk.html
6/4/17 https://cmpassocregulationblog.blogspot.com/2017/06/twenty-two-million-unemployed-or.html
5/21/17 https://cmpassocregulationblog.blogspot.com/2017/05/dollar-devaluation-world-inflation.html
3/12/17 https://cmpassocregulationblog.blogspot.com/2017/03/increasing-interest-rates-twenty-four.html
2/26/17 https://cmpassocregulationblog.blogspot.com/2017/02/united-states-commercial-banks-assets.html
12/4/16 http://cmpassocregulationblog.blogspot.com/2016/12/rising-yields-and-dollar-revaluation.html
11/20/16 http://cmpassocregulationblog.blogspot.com/2016/11/interest-rate-increase-could-well.html
9/11/16 http://cmpassocregulationblog.blogspot.com/2016/09/interest-rate-uncertainty-and-valuation.html
8/14/16 http://cmpassocregulationblog.blogspot.com/2016/08/rising-valuations-of-risk-financial.html
6/5/16 http://cmpassocregulationblog.blogspot.com/2016/06/financial-turbulence-twenty-four.html
5/15/16 http://cmpassocregulationblog.blogspot.com/2016/05/recovery-without-hiring-ten-million.html
3/6/16 http://cmpassocregulationblog.blogspot.com/2016/03/twenty-five-million-unemployed-or.html
2/14/16 http://cmpassocregulationblog.blogspot.com/2016/02/subdued-foreign-growth-and-dollar.html
12/6/15 http://cmpassocregulationblog.blogspot.com/2015/12/liftoff-of-fed-funds-rate-followed-by.html
11/15/15 http://cmpassocregulationblog.blogspot.com/2015/11/interest-rate-policy-conundrum-recovery.html
9/6/15 http://cmpassocregulationblog.blogspot.com/2015/09/interest-rate-policy-dependent-on-what.html
08/16/15 http://cmpassocregulationblog.blogspot.com/2015/08/exchange-rate-and-financial-asset.html
5/31/15 http://cmpassocregulationblog.blogspot.com/2015/06/dollar-revaluation-squeezing-corporate.html
5/17/15 http://cmpassocregulationblog.blogspot.com/2015/05/fluctuating-valuations-of-financial.html
4/26/2015 http://cmpassocregulationblog.blogspot.com/2015/04/imf-view-of-economy-and-finance-united.html
4/19/2015 http://cmpassocregulationblog.blogspot.com/2015/04/global-portfolio-reallocations-squeeze.html
4/5/15 http://cmpassocregulationblog.blogspot.com/2015/04/volatility-of-valuations-of-financial.html
3/15/15 http://cmpassocregulationblog.blogspot.com/2015/03/global-exchange-rate-struggle-recovery.html
2/15/15 http://cmpassocregulationblog.blogspot.com/2015/02/g20-monetary-policy-recovery-without.html
12/7/14 http://cmpassocregulationblog.blogspot.com/2014/12/financial-risks-twenty-six-million.html
11/16/14 http://cmpassocregulationblog.blogspot.com/2014/11/fluctuating-financial-variables.html
10/19/14 http://cmpassocregulationblog.blogspot.com/2014/10/imf-view-squeeze-of-economic-activity.html
8/31/14 http://cmpassocregulationblog.blogspot.com/2014/09/geopo7litical-and-financial-risks.html
8/10/14 http://cmpassocregulationblog.blogspot.com/2014/08/volatility-of-valuations-of-risk_10.html
6/15/2014 http://cmpassocregulationblog.blogspot.com/2014/06/financialgeopolitical-risks-recovery.html
5/18/14 http://cmpassocregulationblog.blogspot.com/2014/05/world-inflation-waves-squeeze-of.html
3/16/2014 http://cmpassocregulationblog.blogspot.com/2014/03/global-financial-risks-recovery-without.html
2/16/14 http://cmpassocregulationblog.blogspot.com/2014/02/theory-and-reality-of-cyclical-slow.html
12/15/13 http://cmpassocregulationblog.blogspot.com/2013/12/theory-and-reality-of-secular.html
11/17/13 http://cmpassocregulationblog.blogspot.com/2013/11/risks-of-unwinding-monetary-policy.html
9/15/13 http://cmpassocregulationblog.blogspot.com/2013/09/recovery-without-hiring-ten-million.html
8/11/13 http://cmpassocregulationblog.blogspot.com/2013/08/recovery-without-hiring-loss-of-full.html
6/16/13 http://cmpassocregulationblog.blogspot.com/2013/06/recovery-without-hiring-seven-million.html
3/17/13 http://cmpassocregulationblog.blogspot.com/2013/03/recovery-without-hiring-ten-million.html
VH United Kingdom. Annual data in Table VH-UK show the strong impact of the global recession in the UK with decline of GDP of 4.2 percent in 2009 after dropping 0.3 percent in 2008. Recovery of 1.9 percent in 2010 is relatively low in comparison with annual growth rates in 2007 and earlier years. Growth was only 1.5 percent in 2011 and 1.5 percent in 2012. Growth increased to 2.1 percent in 2013 and 2.6 percent in 2014. Growth fell to 2.4 percent in 2015, and 1.9 percent in 2016. GDP grew 1.9 percent in 2017. GDP grew 1.3 percent in 2018, growing 1.4 percent in 2019. The bottom part of Table VH-UK provides average growth rates of UK GDP since 1948. The UK economy grew at 2.5 percent per year on average between 1948 and 2019, which is relatively high for an advanced economy. The growth rate of GDP between 2000 and 2007 is higher at 2.8 percent. Growth in the current cyclical expansion from 2010 to 2019 has been only at 1.9 percent as advanced economies struggle with weak internal demand and world trade. GDP in 2019 is higher by 14.8 percent relative to 2007 while it would have been 39.3 higher at trend of 2.8 percent as from 2000 to 2007.
Table VH-UK, UK, Gross Domestic Product, ∆%
∆% on Prior Year | |
1998 | 3.6 |
1999 | 3.4 |
2000 | 3.4 |
2001 | 3.0 |
2002 | 2.3 |
2003 | 3.3 |
2004 | 2.4 |
2005 | 3.2 |
2006 | 2.8 |
2007 | 2.4 |
2008 | -0.3 |
2009 | -4.2 |
2010 | 1.9 |
2011 | 1.5 |
2012 | 1.5 |
2013 | 2.1 |
2014 | 2.6 |
2015 | 2.4 |
2016 | 1.9 |
2017 | 1.9 |
2018 | 1.3 |
2019 | 1.4 |
Average Growth Rates ∆% per Year | |
1948-2019 | 2.5 |
1950-1959 | 3.1 |
1960-1969 | 3.1 |
1970-1979 | 2.6 |
1980-1989 | 3.2 |
1990-1999 | 2.4 |
2000-2007 | 2.8 |
2007-2013* | 2.5 |
2007-2014* | 5.1 |
2007-2015 | 0.9 |
2007-2016 | 1.0 |
2007-2017 | 1.1 |
2007-2018 | 1.1 |
2007-2019 | 1.2 |
2000-2019 | 1.7 |
*Absolute change from 2007 to 2013 and 2007 to 2014
Source: UK Office for National Statistics
The HIS Markit Flash UK PMI® Composite Output Index fell from 52.4 in Jun to 47.7 in Jul, which is the lowest in 87 months (https://www.markiteconomics.com/Survey//PressRelease.mvc/b68c3686a48c40198505b81e4e55cd81). Chris Williamson, Chief Economist at Markit, finds the index suggests pace of contraction of GDP at 0.4 percent in IIIQ2016 (https://www.markiteconomics.com/Survey//PressRelease.mvc/b68c3686a48c40198505b81e4e55cd81). The HIS Markit/CIPS Flash UK Composite PMI increased from 13.8 in Apr 2020 to 28.9 in May 2020 (https://www.markiteconomics.com/Public/Home/PressRelease/c2c5efa8283e40a4b780ff8f45d9c9e2). Chris Williamson, Chief Business Economist at HIS Markit finds that the index suggests contracting of the UK economy at close to 12 percent in 2020 (https://www.markiteconomics.com/Public/Home/PressRelease/c2c5efa8283e40a4b780ff8f45d9c9e2). The HIS Markit/CIPS UK Composite Output Index increased from 13.8 in Apr 2020 to 28.9 in May 2020 (https://www.markiteconomics.com/Public/Home/PressRelease/ed38c310ddc94acbbaa3d3cce8b3ff7b). Tim Moore, Economics Director at IHS Markit, finds contracting activity (https://www.markiteconomics.com/Public/Home/PressRelease/ed38c310ddc94acbbaa3d3cce8b3ff7b). The Business Activity Index of the IHS Markit/CIPS UK Services PMI® increased from 13.4 in Apr to 27.8 in May (https://www.markiteconomics.com/Public/Home/PressRelease/ed38c310ddc94acbbaa3d3cce8b3ff7b). The IHS Markit/CIPS UK Manufacturing Purchasing Managers’ Index® (PMI®) increased to 40.7 in May from 32.6 in Mar (https://www.markiteconomics.com/Public/Home/PressRelease/a586ad660bc74f9ea79ee2c9fb824742). New export orders decreased. Rob Dobson, Director at IHS Markit that compiles the Markit/CIPS Manufacturing PMI®, finds contracting manufacturing (https://www.markiteconomics.com/Public/Home/PressRelease/a586ad660bc74f9ea79ee2c9fb824742). Table UK provides the economic indicators for the United Kingdom.
Table UK, UK Economic Indicators
CPI | Apr month ∆%: -0.2 |
Output/Input Prices | Output Prices: Apr 12-month NSA ∆%: -0.7 excluding food, petroleum ∆%: 0.6 |
GDP Growth | IQ2020 prior quarter ∆% minus 2.0; year earlier same quarter ∆%: minus 1.6 |
Industrial Production | Mar 2020/Mar 2019 ∆%: Production Industries -8.2; Manufacturing -9.7 Earlier Data: |
Retail Sales | Jan month ∆%: 0.9 Earlier Data: |
Labor Market | Jan-Mar 2020 Unemployment Rate: 3.9% |
GDP and the Labor Market | IQ2015 Employment 104.8 IQ2008 =100 GDP IQ15=104.0 IQ2008=100 Blog 5/17/14 |
Trade Balance UK Trade in Goods and Services | Balance Mar SA -£6,676 million EARLIER DATA: |
Links to blog comments in Table UK: 5/24/2020 https://cmpassocregulationblog.blogspot.com/2020/05/recovery-without-hiring-twenty-million.html
5/17/20 https://cmpassocregulationblog.blogspot.com/2020/05/united-states-inflation-rules.html
4/26/20 https://cmpassocregulationblog.blogspot.com/2020/04/valuations-of-risk-financial-assets.html
4/12/20 https://cmpassocregulationblog.blogspot.com/2020/04/united-states-imbalances-of-internal.html
3/29/2020 https://cmpassocregulationblog.blogspot.com/2020/03/weekly-rise-of-valuations-of-risk.html
2/23/20 https://cmpassocregulationblog.blogspot.com/2020/02/declining-valuations-of-risk-financial.html
1/26/20 https://cmpassocregulationblog.blogspot.com/2020/01/declining-valuations-of-risk-financial.html
1/5/20 https://cmpassocregulationblog.blogspot.com/2020/01/fluctuating-valuations-of-risk.html
12/29/19 https://cmpassocregulationblog.blogspot.com/2019/12/diverging-economic-conditions-and.html
11/17/19 https://cmpassocregulationblog.blogspot.com/2019/11/increasing-valuations-of-risk-financial_16.html
11/3/19 https://cmpassocregulationblog.blogspot.com/2019/11/decrease-of-fomc-policy-rate-monetary.html
10/20/19 https://cmpassocregulationblog.blogspot.com/2019/10/dollar-depreciation-fluctuating.html
10/6/19 https://cmpassocregulationblog.blogspot.com/2019/10/volatility-of-valuations-of-risk.html
9/22/19 https://cmpassocregulationblog.blogspot.com/2019/09/uncertain-fomc-outlook-of-monetary.html
9/15/19 https://cmpassocregulationblog.blogspot.com/2019/09/competitive-exchange-rate-and-interest.html
8/18/19 https://cmpassocregulationblog.blogspot.com/2019/08/global-decline-of-yields-of-government.html
7/21/2019 https://cmpassocregulationblog.blogspot.com/2019/07/global-manufacturing-stress-world.html
7/7/19 https://cmpassocregulationblog.blogspot.com/2019/07/twenty-million-unemployed-or.html
5/19/19 https://cmpassocregulationblog.blogspot.com/2019/05/decreasing-valuations-of-risk-financial.html
4/7/19 https://cmpassocregulationblog.blogspot.com/2019/04/flattening-yield-curve-of-treasury.html
2/17/19 https://cmpassocregulationblog.blogspot.com/2019/02/dollar-revaluation-with-increases-in.html
12/30/18 https://cmpassocregulationblog.blogspot.com/2018/12/mediocre-cyclical-united-states.html
11/18/18 https://cmpassocregulationblog.blogspot.com/2018/11/weakening-gdp-growth-in-major-economies.html
10/7/18 https://cmpassocregulationblog.blogspot.com/2018/10/twenty-one-million-unemployed-or.html
8/19/18 https://cmpassocregulationblog.blogspot.com/2018/08/world-inflation-waves-lost-economic.html
7/8/18 https://cmpassocregulationblog.blogspot.com/2018/07/twenty-one-million-unemployed-or.html
5/27/2018 https://cmpassocregulationblog.blogspot.com/2018/05/dollar-strengthening-world-inflation.html
5/6/2018 https://cmpassocregulationblog.blogspot.com/2018/05/twenty-one-million-unemployed-or.html
4/8/18 https://cmpassocregulationblog.blogspot.com/2018/04/twenty-two-million-unemployed-or.html
2/25/18 https://cmpassocregulationblog.blogspot.com/2018/02/world-inflation-waves-united-states.html
2/4/18 https://cmpassocregulationblog.blogspot.com/2018/02/twenty-four-million-unemployed-or.html
12/31/17 https://cmpassocregulationblog.blogspot.com/2017/12/dollar-devaluation-cyclically.html
11/26/17 https://cmpassocregulationblog.blogspot.com/2017/11/the-lost-economic-cycle-of-global_25.html
10/29/17 https://cmpassocregulationblog.blogspot.com/2017/10/dollar-revaluation-and-increase-of.html
10/8/17 https://cmpassocregulationblog.blogspot.com/2017/10/twenty-one-million-unemployed-or.html
8/27/17 https://cmpassocregulationblog.blogspot.com/2017/08/dollar-devaluation-and-interest-rate.html
7/30/17 https://cmpassocregulationblog.blogspot.com/2017/07/data-dependent-monetary-policy-with_30.html
7/9/17 https://cmpassocregulationblog.blogspot.com/2017/07/rising-yields-twenty-two-million.html
5/28/17 https://cmpassocregulationblog.blogspot.com/2017/05/mediocre-cyclical-united-states.html
2/26/17 https://cmpassocregulationblog.blogspot.com/2017/02/united-states-commercial-banks-assets.html
2/5/17 https://cmpassocregulationblog.blogspot.com/2017/02/twenty-six-million-unemployed-or.html
1/1/17 http://cmpassocregulationblog.blogspot.com/2017/01/rules-versus-discretionary-authorities.html
11/27/16 http://cmpassocregulationblog.blogspot.com/2016/11/dollar-revaluation-rising-yields-and.html
10/30/16 http://cmpassocregulationblog.blogspot.com/2016/10/mediocre-cyclical-united-states_30.html
10/9/16 http://cmpassocregulationblog.blogspot.com/2016/10/twenty-four-million-unemployed-or.html
9/4/16 http://cmpassocregulationblog.blogspot.com/2016/09/interest-rates-and-valuations-of-risk.html
7/31/16 http://cmpassocregulationblog.blogspot.com/2016/07/business-fixed-investment-has-been-soft.html
7/3/16 http://cmpassocregulationblog.blogspot.com/2016/07/financial-asset-values-rebound-from.html
5/29/16 http://cmpassocregulationblog.blogspot.com/2016/05/appropriate-for-fed-to-increase.html
5/1/16 http://cmpassocregulationblog.blogspot.com/2016/05/economic-activity-appears-to-have.html
4/3/16 http://cmpassocregulationblog.blogspot.com/2016/04/proceeding-cautiously-in-monetary.html
2/28/16 http://cmpassocregulationblog.blogspot.com/2016/02/mediocre-cyclical-united-states.html
1/31/16 http://cmpassocregulationblog.blogspot.com/2016/01/closely-monitoring-global-economic-and.html
12/27/15 http://cmpassocregulationblog.blogspot.com/2015/12/dollar-revaluation-and-decreasing.html
11/29/15 http://cmpassocregulationblog.blogspot.com/2015/11/dollar-revaluation-constraining.html
11/1/15 http://cmpassocregulationblog.blogspot.com/2015/11/interest-rate-increase-considered.html
10/4/15 http://cmpassocregulationblog.blogspot.com/2015/10/labor-market-uncertainty-and-interest.html
9/6/15 http://cmpassocregulationblog.blogspot.com/2015/09/interest-rate-policy-dependent-on-what.html
08/02/15 http://cmpassocregulationblog.blogspot.com/2015/08/turbulence-of-valuations-of-financial.html
7/5/15 http://cmpassocregulationblog.blogspot.com/2015/07/turbulence-of-financial-asset.html
5/31/15 http://cmpassocregulationblog.blogspot.com/2015/06/dollar-revaluation-squeezing-corporate.html
5/17/15 http://cmpassocregulationblog.blogspot.com/2015/05/fluctuating-valuations-of-financial.html
5/3/15 http://cmpassocregulationblog.blogspot.com/2015/05/dollar-devaluation-and-carry-trade.html
4/26/2015 http://cmpassocregulationblog.blogspot.com/2015/04/imf-view-of-economy-and-finance-united.html
4/12/15 http://cmpassocregulationblog.blogspot.com/2015/04/dollar-revaluation-recovery-without.html
4/5/15 http://cmpassocregulationblog.blogspot.com/2015/04/volatility-of-valuations-of-financial.html
3/1/15 http://cmpassocregulationblog.blogspot.com/2015/03/irrational-exuberance-mediocre-cyclical.html
2/1/15 http://cmpassocregulationblog.blogspot.com/2015/02/financial-and-international.html
12/28/14 http://cmpassocregulationblog.blogspot.com/2014/12/valuations-of-risk-financial-assets.html
11/30/14 http://cmpassocregulationblog.blogspot.com/2014/11/valuations-of-risk-financial-assets.html
10/26/14 http://cmpassocregulationblog.blogspot.com/2014/10/financial-oscillations-world-inflation.html
10/5/14 http://cmpassocregulationblog.blogspot.com/2014/10/world-financial-turbulence-twenty-seven.html
8/17/2014 http://cmpassocregulationblog.blogspot.com/2014/08/weakening-world-economic-growth.html
7/27/14 http://cmpassocregulationblog.blogspot.com/2014/07/world-inflation-waves-united-states.html
6/29/14 http://cmpassocregulationblog.blogspot.com/2014/06/financial-indecision-mediocre-cyclical.html
5/25/14 http://cmpassocregulationblog.blogspot.com/2014/05/united-states-commercial-banks-assets.html
5/4/2014 http://cmpassocregulationblog.blogspot.com/2014/05/financial-volatility-mediocre-cyclical.html
4/6/14 http://cmpassocregulationblog.blogspot.com/2014/04/interest-rate-risks-twenty-eight.html
3/2/14 http://cmpassocregulationblog.blogspot.com/2014/03/financial-risks-slow-cyclical-united.html
2/2/14 http://cmpassocregulationblog.blogspot.com/2014/02/mediocre-cyclical-united-states.html
12/22/13 http://cmpassocregulationblog.blogspot.com/2013/12/tapering-quantitative-easing-mediocre.html
12/1/13 http://cmpassocregulationblog.blogspot.com/2013/12/exit-risks-of-zero-interest-rates-world.html
10/27/13 http://cmpassocregulationblog.blogspot.com/2013/10/twenty-eight-million-unemployed-or.html
9/29/13 http://cmpassocregulationblog.blogspot.com/2013/09/mediocre-and-decelerating-united-states.html
8/25/13 http://cmpassocregulationblog.blogspot.com/2013/08/interest-rate-risks-duration-dumping.html
7/28/13 http://cmpassocregulationblog.blogspot.com/2013/07/duration-dumping-steepening-yield-curve.html
5/26/13 http://cmpassocregulationblog.blogspot.com/2013/05/united-states-commercial-banks-assets.html
4/28/13 http://cmpassocregulationblog.blogspot.com/2013/04/mediocre-and-decelerating-united-states_28.html
03/31/13 http://cmpassocregulationblog.blogspot.com/2013/04/mediocre-and-decelerating-united-states.html
© Carlos M. Pelaez, 2009, 2010, 2011, 2012, 2013, 2014, 2015, 2016, 2017, 2018, 2019, 2020.
No comments:
Post a Comment