
CANNOT UPLOAD CHARTS AND IMAGES
The Lost Economic Cycle of the Global Recession with Economic Growth Underperforming below Trend Worldwide, Dollar Devaluation, United States Commercial Assets and Liabilities, United States Industrial Production, Squeeze of Economic Activity by Carry Trades Induced by Zero Interest Rates, Collapse of United States Dynamism of Income Growth and Employment Creation, World Cyclical Slow Growth and Global Recession Risk
© Carlos M. Pelaez, 2009, 2010, 2011, 2012, 2013, 2014, 2015, 2016, 2017
I United States Commercial Banks Assets and Liabilities
IA Transmission of Monetary Policy
IB Functions of Banking
IC United States Commercial Banks Assets and Liabilities
ID Theory and Reality of Economic History, Cyclical Slow Growth Not Secular Stagnation and Monetary Policy Based on Fear of Deflation
II United States Industrial Production
IIA Squeeze of Economic Activity by Carry Trades Induced by Zero Interest Rates,
II IB Collapse of United States Dynamism of Income Growth and Employment Creation
III World Financial Turbulence
IIIA Financial Risks
IIIE Appendix Euro Zone Survival Risk
IIIF Appendix on Sovereign Bond Valuation
IV Global Inflation
V World Economic Slowdown
VA United States
VB Japan
VC China
VD Euro Area
VE Germany
VF France
VG Italy
VH United Kingdom
VI Valuation of Risk Financial Assets
VII Economic Indicators
VIII Interest Rates
IX Conclusion
References
Appendixes
Appendix I The Great Inflation
IIIB Appendix on Safe Haven Currencies
IIIC Appendix on Fiscal Compact
IIID Appendix on European Central Bank Large Scale Lender of Last Resort
IIIG Appendix on Deficit Financing of Growth and the Debt Crisis
- Mediocre economic growth below potential and long-term trend, resulting in idle productive resources with GDP two trillion dollars below trend (https://cmpassocregulationblog.blogspot.com/2017/10/dollar-revaluation-and-increase-of.html and earlier https://cmpassocregulationblog.blogspot.com/2017/10/destruction-of-household-nonfinancial.html). US GDP grew at the average rate of 3.2 percent per year from 1929 to 2016, with similar performance in whole cycles of contractions and expansions, but only at 1.3 percent per year on average from 2007 to 2016. GDP in IIIQ2017 is 14.2 percent lower than what it would have been had it grown at trend of 3.0 percent
- Private fixed investment stagnating at cumulative increase of 12.5 percent in the entire cycle from IVQ2007 to IIIQ2017 (https://cmpassocregulationblog.blogspot.com/2017/10/dollar-revaluation-and-increase-of.html and earlier https://cmpassocregulationblog.blogspot.com/2017/10/destruction-of-household-nonfinancial.html)
- Twenty one million or 12.5 percent of the effective labor force unemployed or underemployed in involuntary part-time jobs with stagnating or declining real wages (https://cmpassocregulationblog.blogspot.com/2017/11/unchanged-fomc-policy-rate-gradual.html and earlier https://cmpassocregulationblog.blogspot.com/2017/10/twenty-one-million-unemployed-or.html and earlier https://cmpassocregulationblog.blogspot.com/2017/09/twenty-two-million-unemployed-or.html and earlier https://cmpassocregulationblog.blogspot.com/2017/08/data-dependent-monetary-policy-with.html and earlier https://cmpassocregulationblog.blogspot.com/2017/07/rising-yields-twenty-two-million.html and earlier https://cmpassocregulationblog.blogspot.com/2017/06/twenty-two-million-unemployed-or.html and earlier https://cmpassocregulationblog.blogspot.com/2017/05/twenty-two-million-unemployed-or.html and earlier https://cmpassocregulationblog.blogspot.com/2017/04/twenty-three-million-unemployed-or.html and earlier https://cmpassocregulationblog.blogspot.com/2017/03/increasing-interest-rates-twenty-four.html and earlier https://cmpassocregulationblog.blogspot.com/2017/02/twenty-six-million-unemployed-or.html and earlier http://cmpassocregulationblog.blogspot.com/2017/01/twenty-four-million-unemployed-or.html and earlier http://cmpassocregulationblog.blogspot.com/2016/12/rising-yields-and-dollar-revaluation.html and earlier http://cmpassocregulationblog.blogspot.com/2016/11/the-case-for-increase-in-federal-funds.html and earlier http://cmpassocregulationblog.blogspot.com/2016/10/twenty-four-million-unemployed-or.html and earlier http://cmpassocregulationblog.blogspot.com/2016/09/interest-rates-and-valuations-of-risk.html and earlier http://cmpassocregulationblog.blogspot.com/2016/08/global-competitive-easing-or.html and earlier http://cmpassocregulationblog.blogspot.com/2016/07/fluctuating-valuations-of-risk.html and earlier http://cmpassocregulationblog.blogspot.com/2016/06/financial-turbulence-twenty-four.html and earlier http://cmpassocregulationblog.blogspot.com/2016/05/twenty-four-million-unemployed-or.html and earlier http://cmpassocregulationblog.blogspot.com/2016/04/proceeding-cautiously-in-monetary.html and earlier http://cmpassocregulationblog.blogspot.com/2016/03/twenty-five-million-unemployed-or.html and earlier http://cmpassocregulationblog.blogspot.com/2016/02/fluctuating-risk-financial-assets-in.html and earlier http://cmpassocregulationblog.blogspot.com/2016/01/weakening-equities-with-exchange-rate.html and earlier (http://cmpassocregulationblog.blogspot.com/2015/12/liftoff-of-fed-funds-rate-followed-by.html and earlier http://cmpassocregulationblog.blogspot.com/2015/11/live-possibility-of-interest-rates.html and earlier http://cmpassocregulationblog.blogspot.com/2015/10/labor-market-uncertainty-and-interest.html and earlier http://cmpassocregulationblog.blogspot.com/2015/09/interest-rate-policy-dependent-on-what.html and earlier http://cmpassocregulationblog.blogspot.com/2015/08/fluctuating-risk-financial-assets.html and earlier http://cmpassocregulationblog.blogspot.com/2015/07/turbulence-of-financial-asset.html)
- Stagnating real disposable income per person or income per person after inflation and taxes (https://cmpassocregulationblog.blogspot.com/2017/11/unchanged-fomc-policy-rate-gradual.html and earlier https://cmpassocregulationblog.blogspot.com/2017/10/twenty-one-million-unemployed-or.html and earlier https://cmpassocregulationblog.blogspot.com/2017/09/twenty-two-million-unemployed-or.html and earlier https://cmpassocregulationblog.blogspot.com/2017/08/data-dependent-monetary-policy-with.html and earlier https://cmpassocregulationblog.blogspot.com/2017/07/rising-yields-twenty-two-million.html and earlier https://cmpassocregulationblog.blogspot.com/2017/06/twenty-two-million-unemployed-or.html and earlier https://cmpassocregulationblog.blogspot.com/2017/05/twenty-two-million-unemployed-or.html and earlier https://cmpassocregulationblog.blogspot.com/2017/04/twenty-three-million-unemployed-or.html and earlier https://cmpassocregulationblog.blogspot.com/2017/03/rising-valuations-of-risk-financial.html and earlier https://cmpassocregulationblog.blogspot.com/2017/02/twenty-six-million-unemployed-or.html and earlier http://cmpassocregulationblog.blogspot.com/2017/01/twenty-four-million-unemployed-or.html and earlier http://cmpassocregulationblog.blogspot.com/2016/12/rising-yields-and-dollar-revaluation.html and earlier http://cmpassocregulationblog.blogspot.com/2016/12/mediocre-cyclical-united-states.html and earlier http://cmpassocregulationblog.blogspot.com/2016/12/rising-yields-and-dollar-revaluation.html and earlier http://cmpassocregulationblog.blogspot.com/2016/11/the-case-for-increase-in-federal-funds.html and earlier http://cmpassocregulationblog.blogspot.com/2016/11/the-case-for-increase-in-federal-funds.html and earlier http://cmpassocregulationblog.blogspot.com/2016/10/twenty-four-million-unemployed-or.html and earlier http://cmpassocregulationblog.blogspot.com/2016/09/interest-rates-and-valuations-of-risk.html and earlier http://cmpassocregulationblog.blogspot.com/2016/08/global-competitive-easing-or.html and earlier (http://cmpassocregulationblog.blogspot.com/2016/07/financial-asset-values-rebound-from.html and earlier http://cmpassocregulationblog.blogspot.com/2016/06/financial-turbulence-twenty-four.html and earlier http://cmpassocregulationblog.blogspot.com/2016/05/twenty-four-million-unemployed-or.html and earlier http://cmpassocregulationblog.blogspot.com/2016/04/proceeding-cautiously-in-monetary.html and earlier http://cmpassocregulationblog.blogspot.com/2016/03/twenty-five-million-unemployed-or.html and earlier http://cmpassocregulationblog.blogspot.com/2016/03/twenty-five-million-unemployed-or.html and earlier http://cmpassocregulationblog.blogspot.com/2016/02/fluctuating-risk-financial-assets-in.html and earlier http://cmpassocregulationblog.blogspot.com/2015/12/dollar-revaluation-and-decreasing.html and earlier http://cmpassocregulationblog.blogspot.com/2015/11/dollar-revaluation-constraining.html and earlier http://cmpassocregulationblog.blogspot.com/2015/11/dollar-revaluation-constraining.html and earlier http://cmpassocregulationblog.blogspot.com/2015/11/live-possibility-of-interest-rates.html and earlier http://cmpassocregulationblog.blogspot.com/2015/10/labor-market-uncertainty-and-interest.html and earlier http://cmpassocregulationblog.blogspot.com/2015/09/interest-rate-policy-dependent-on-what.html and earlier http://cmpassocregulationblog.blogspot.com/2015/08/fluctuating-risk-financial-assets.html and earlier http://cmpassocregulationblog.blogspot.com/2015/06/international-valuations-of-financial.html and earlier http://cmpassocregulationblog.blogspot.com/2015/06/higher-volatility-of-asset-prices-at.html and earlier http://cmpassocregulationblog.blogspot.com/2015/05/dollar-devaluation-and-carry-trade.html and earlier http://cmpassocregulationblog.blogspot.com/2015/04/volatility-of-valuations-of-financial.html)
- Depressed hiring that does not afford an opportunity for reducing unemployment/underemployment and moving to better-paid jobs (https://cmpassocregulationblog.blogspot.com/2017/11/recovery-without-hiring-ten-million.html and earlier https://cmpassocregulationblog.blogspot.com/2017/10/increasing-valuations-of-risk-financial.html and earlier https://cmpassocregulationblog.blogspot.com/2017/09/dollar-devaluation-world-inflation.html and earlier https://cmpassocregulationblog.blogspot.com/2017/08/recovery-without-hiring-ten-million_40.html and earlier https://cmpassocregulationblog.blogspot.com/2017/07/dollar-devaluation-and-valuation-of.html and earlier https://cmpassocregulationblog.blogspot.com/2017/06/flattening-us-treasury-yield-curve.html and earlier https://cmpassocregulationblog.blogspot.com/2017/05/recovery-without-hiring-ten-million_14.html and earlier https://cmpassocregulationblog.blogspot.com/2017/04/world-inflation-waves-united-states.html and earlier https://cmpassocregulationblog.blogspot.com/2017/03/recovery-without-hiring-ten-million.html and earlier https://cmpassocregulationblog.blogspot.com/2017/02/recovery-without-hiring-ten-million.html and earlier http://cmpassocregulationblog.blogspot.com/2017/01/unconventional-monetary-policy-and.html and earlier http://cmpassocregulationblog.blogspot.com/2016/12/rising-values-of-risk-financial-assets.html and earlier http://cmpassocregulationblog.blogspot.com/2016/11/dollar-revaluation-and-valuations-of.html and earlier http://cmpassocregulationblog.blogspot.com/2016/10/imf-view-of-world-economy-and-finance.html and earlier http://cmpassocregulationblog.blogspot.com/2016/09/interest-rate-uncertainty-and-valuation.html and earlier http://cmpassocregulationblog.blogspot.com/2016/08/rising-valuations-of-risk-financial.html and earlier http://cmpassocregulationblog.blogspot.com/2016/07/oscillating-valuations-of-risk.html and earlier http://cmpassocregulationblog.blogspot.com/2016/06/considerable-uncertainty-about-economic.html and earlier http://cmpassocregulationblog.blogspot.com/2016/05/recovery-without-hiring-ten-million.html and earlier http://cmpassocregulationblog.blogspot.com/2016/04/proceeding-cautiously-in-reducing.html and earlier http://cmpassocregulationblog.blogspot.com/2016/03/contraction-of-united-states-corporate.html and earlier http://cmpassocregulationblog.blogspot.com/2016/02/subdued-foreign-growth-and-dollar.html and earlier http://cmpassocregulationblog.blogspot.com/2016/01/unconventional-monetary-policy-and.html and earlier http://cmpassocregulationblog.blogspot.com/2015/12/liftoff-of-interest-rates-with-volatile_17.html and earlier http://cmpassocregulationblog.blogspot.com/2015/11/interest-rate-policy-conundrum-recovery.html and earlier http://cmpassocregulationblog.blogspot.com/2015/10/impact-of-monetary-policy-on-exchange.html and earlier http://cmpassocregulationblog.blogspot.com/2015/09/interest-rate-policy-dependent-on-what_13.html and earlier http://cmpassocregulationblog.blogspot.com/2015/08/exchange-rate-and-financial-asset.html and earlier http://cmpassocregulationblog.blogspot.com/2015/07/oscillating-valuations-of-risk.html and earlier http://cmpassocregulationblog.blogspot.com/2015/06/volatility-of-financial-asset.html and earlier http://cmpassocregulationblog.blogspot.com/2015/06/volatility-of-financial-asset.html and earlier http://cmpassocregulationblog.blogspot.com/2015/05/fluctuating-valuations-of-financial.html and earlier http://cmpassocregulationblog.blogspot.com/2015/04/dollar-revaluation-recovery-without.html and earlier http://cmpassocregulationblog.blogspot.com/2015/03/global-exchange-rate-struggle-recovery.html and earlier (http://cmpassocregulationblog.blogspot.com/2015/02/g20-monetary-policy-recovery-without.html)
- Productivity growth fell from 2.1 percent per year on average from 1947 to 2016 and average 2.3 percent per year from 1947 to 2007 to 1.2 percent per year on average from 2007 to 2016, deteriorating future growth and prosperity (https://cmpassocregulationblog.blogspot.com/2017/11/recovery-without-hiring-ten-million.html and earlier https://cmpassocregulationblog.blogspot.com/2017/09/ii-rules-discretionary-authorities-and.html and earlier https://cmpassocregulationblog.blogspot.com/2017/08/recovery-without-hiring-ten-million_40.html and earlier https://cmpassocregulationblog.blogspot.com/2017/06/flattening-us-treasury-yield-curve.html and earlier https://cmpassocregulationblog.blogspot.com/2017/05/recovery-without-hiring-ten-million_14.html and earlier https://cmpassocregulationblog.blogspot.com/2017/03/increasing-interest-rates-twenty-four.html and earlier http://cmpassocregulationblog.blogspot.com/2016/12/rising-values-of-risk-financial-assets.html and earlier http://cmpassocregulationblog.blogspot.com/2016/11/the-case-for-increase-in-federal-funds.html and earlier http://cmpassocregulationblog.blogspot.com/2016/09/interest-rates-and-valuations-of-risk.html and earlier http://cmpassocregulationblog.blogspot.com/2016/08/rising-valuations-of-risk-financial.html and earlier http://cmpassocregulationblog.blogspot.com/2016/06/considerable-uncertainty-about-economic.html and earlier http://cmpassocregulationblog.blogspot.com/2016/05/twenty-four-million-unemployed-or.html and earlier http://cmpassocregulationblog.blogspot.com/2016/03/twenty-five-million-unemployed-or.html and earlier http://cmpassocregulationblog.blogspot.com/2016/01/closely-monitoring-global-economic-and.html and earlier http://cmpassocregulationblog.blogspot.com/2015/12/liftoff-of-fed-funds-rate-followed-by.html and earlier http://cmpassocregulationblog.blogspot.com/2015/11/live-possibility-of-interest-rates.html and earlier http://cmpassocregulationblog.blogspot.com/2015/09/interest-rate-policy-dependent-on-what.html and earlier http://cmpassocregulationblog.blogspot.com/2015/08/exchange-rate-and-financial-asset.html and earlier http://cmpassocregulationblog.blogspot.com/2015/06/higher-volatility-of-asset-prices-at.html and earlier http://cmpassocregulationblog.blogspot.com/2015/05/quite-high-equity-valuations-and.html and earlier http://cmpassocregulationblog.blogspot.com/2015/03/global-competitive-devaluation-rules.html and earlier http://cmpassocregulationblog.blogspot.com/2015/02/job-creation-and-monetary-policy-twenty.html and earlier http://cmpassocregulationblog.blogspot.com/2014/12/financial-risks-twenty-six-million.html)
- Output of manufacturing in Oct 2017 at 27.4 percent below long-term trend since 1919 and at 20.1 percent below trend since 1986 (Section II and earlier https://cmpassocregulationblog.blogspot.com/2017/10/world-inflation-waves-long-term-and.html and earlier) (https://cmpassocregulationblog.blogspot.com/2017/09/monetary-policy-of-reducing-central.html and earlier https://cmpassocregulationblog.blogspot.com/2017/08/fluctuating-valuations-of-risk.html and earlier (https://cmpassocregulationblog.blogspot.com/2017/07/rising-valuations-of-risk-financial.html and earlier https://cmpassocregulationblog.blogspot.com/2017/06/fomc-interest-rate-increase-planned.html and earlier https://cmpassocregulationblog.blogspot.com/2017/05/dollar-devaluation-world-inflation.html and earlier https://cmpassocregulationblog.blogspot.com/2017/04/united-states-commercial-banks-assets.html and earlier https://cmpassocregulationblog.blogspot.com/2017/03/fomc-increases-interest-rates-world.html and earlier https://cmpassocregulationblog.blogspot.com/2017/02/world-inflation-waves-united-states.html and earlier http://cmpassocregulationblog.blogspot.com/2017/01/world-inflation-waves-united-states.html and earlier http://cmpassocregulationblog.blogspot.com/2016/12/of-course-economic-outlook-is-highly.html and earlier http://cmpassocregulationblog.blogspot.com/2016/11/interest-rate-increase-could-well.html and earlier http://cmpassocregulationblog.blogspot.com/2016/10/dollar-revaluation-world-inflation.html and earlier http://cmpassocregulationblog.blogspot.com/2016/09/interest-rates-and-volatility-of-risk.html and earlier http://cmpassocregulationblog.blogspot.com/2016/08/interest-rate-policy-uncertainty-and.html and earlier (http://cmpassocregulationblog.blogspot.com/2016/07/unresolved-us-balance-of-payments.html and earlier http://cmpassocregulationblog.blogspot.com/2016/06/fomc-projections-world-inflation-waves.html and earlier (http://cmpassocregulationblog.blogspot.com/2016/05/most-fomc-participants-judged-that-if.html and earlier (http://cmpassocregulationblog.blogspot.com/2016/04/contracting-united-states-industrial.html and earlier (http://cmpassocregulationblog.blogspot.com/2016/03/monetary-policy-and-competitive.html and earlier http://cmpassocregulationblog.blogspot.com/2016/02/squeeze-of-economic-activity-by-carry.html and earlier http://cmpassocregulationblog.blogspot.com/2016/01/unconventional-monetary-policy-and.html and earlier http://cmpassocregulationblog.blogspot.com/2015/12/liftoff-of-interest-rates-with-monetary.html and earlier http://cmpassocregulationblog.blogspot.com/2015/11/interest-rate-liftoff-followed-by.html http://cmpassocregulationblog.blogspot.com/2015/10/interest-rate-policy-quagmire-world.html and earlier http://cmpassocregulationblog.blogspot.com/2015/09/interest-rate-increase-on-hold-because.html and earlier http://cmpassocregulationblog.blogspot.com/2015/08/exchange-rate-and-financial-asset.html
and earlier http://cmpassocregulationblog.blogspot.com/2015/07/fluctuating-risk-financial-assets.html and earlier http://cmpassocregulationblog.blogspot.com/2015/06/fluctuating-financial-asset-valuations.html and earlier http://cmpassocregulationblog.blogspot.com/2015/05/fluctuating-valuations-of-financial.html and earlier http://cmpassocregulationblog.blogspot.com/2015/04/global-portfolio-reallocations-squeeze.html and earlier http://cmpassocregulationblog.blogspot.com/2015/03/impatience-with-monetary-policy-of.html and earlier (http://cmpassocregulationblog.blogspot.com/2015/02/world-financial-turbulence-squeeze-of.html and earlier http://cmpassocregulationblog.blogspot.com/2015/01/exchange-rate-conflicts-squeeze-of.html and earlier http://cmpassocregulationblog.blogspot.com/2014/12/patience-on-interest-rate-increases.html and earlier http://cmpassocregulationblog.blogspot.com/2014/11/squeeze-of-economic-activity-by-carry.html and earlier http://cmpassocregulationblog.blogspot.com/2014/10/imf-view-squeeze-of-economic-activity.html and earlier http://cmpassocregulationblog.blogspot.com/2014/09/world-inflation-waves-squeeze-of.html)
- Unsustainable government deficit/debt and balance of payments deficit (https://cmpassocregulationblog.blogspot.com/2017/04/mediocre-cyclical-economic-growth-with.html and earlier http://cmpassocregulationblog.blogspot.com/2017/01/twenty-four-million-unemployed-or.html and earlier http://cmpassocregulationblog.blogspot.com/2016/12/rising-yields-and-dollar-revaluation.html and earlier http://cmpassocregulationblog.blogspot.com/2016/07/unresolved-us-balance-of-payments.html and earlier http://cmpassocregulationblog.blogspot.com/2016/04/proceeding-cautiously-in-reducing.html and earlier http://cmpassocregulationblog.blogspot.com/2016/01/weakening-equities-and-dollar.html and earlier http://cmpassocregulationblog.blogspot.com/2015/09/monetary-policy-designed-on-measurable.html and earlier http://cmpassocregulationblog.blogspot.com/2015/06/fluctuating-financial-asset-valuations.html and earlier http://cmpassocregulationblog.blogspot.com/2015/03/impatience-with-monetary-policy-of.html and earlier http://cmpassocregulationblog.blogspot.com/2015/03/irrational-exuberance-mediocre-cyclical.html and earlier http://cmpassocregulationblog.blogspot.com/2014/12/patience-on-interest-rate-increases.html http://cmpassocregulationblog.blogspot.com/2014/09/world-inflation-waves-squeeze-of.html http://cmpassocregulationblog.blogspot.com/2014/08/monetary-policy-world-inflation-waves.html http://cmpassocregulationblog.blogspot.com/2014/06/valuation-risks-world-inflation-waves.html http://cmpassocregulationblog.blogspot.com/2014/02/theory-and-reality-of-cyclical-slow.html http://cmpassocregulationblog.blogspot.com/2014/03/interest-rate-risks-world-inflation.html http://cmpassocregulationblog.blogspot.com/2013/12/tapering-quantitative-easing-mediocre.html and earlier http://cmpassocregulationblog.blogspot.com/2013/09/duration-dumping-and-peaking-valuations.html)
- Worldwide waves of inflation (https://cmpassocregulationblog.blogspot.com/2017/11/dollar-devaluation-and-decline-of.html and earlier https://cmpassocregulationblog.blogspot.com/2017/10/world-inflation-waves-long-term-and.html and earlier https://cmpassocregulationblog.blogspot.com/2017/09/dollar-devaluation-world-inflation.html and earlier https://cmpassocregulationblog.blogspot.com/2017/08/fluctuating-valuations-of-risk.html and earlier https://cmpassocregulationblog.blogspot.com/2017/07/dollar-devaluation-and-valuation-of.html and earlier https://cmpassocregulationblog.blogspot.com/2017/06/fomc-interest-rate-increase-planned.html and earlier https://cmpassocregulationblog.blogspot.com/2017/05/dollar-devaluation-world-inflation.html and earlier https://cmpassocregulationblog.blogspot.com/2017/04/world-inflation-waves-united-states.html and earlier https://cmpassocregulationblog.blogspot.com/2017/03/fomc-increases-interest-rates-world.html and earlier https://cmpassocregulationblog.blogspot.com/2017/02/world-inflation-waves-united-states.html and earlier http://cmpassocregulationblog.blogspot.com/2017/01/world-inflation-waves-united-states.html and earlier http://cmpassocregulationblog.blogspot.com/2016/12/of-course-economic-outlook-is-highly.html and earlier http://cmpassocregulationblog.blogspot.com/2016/11/interest-rate-increase-could-well.html and earlier http://cmpassocregulationblog.blogspot.com/2016/10/dollar-revaluation-world-inflation.html and earlier (http://cmpassocregulationblog.blogspot.com/2016/09/interest-rates-and-volatility-of-risk.html and earlier http://cmpassocregulationblog.blogspot.com/2016/08/interest-rate-policy-uncertainty-and.html and earlier http://cmpassocregulationblog.blogspot.com/2016/07/oscillating-valuations-of-risk.html and earlier http://cmpassocregulationblog.blogspot.com/2016/06/fomc-projections-world-inflation-waves.html and earlier http://cmpassocregulationblog.blogspot.com/2016/05/most-fomc-participants-judged-that-if.html and earlier http://cmpassocregulationblog.blogspot.com/2016/04/contracting-united-states-industrial.html and earlier http://cmpassocregulationblog.blogspot.com/2016/03/monetary-policy-and-competitive.html and earlier http://cmpassocregulationblog.blogspot.com/2016/02/squeeze-of-economic-activity-by-carry.html and earlier http://cmpassocregulationblog.blogspot.com/2016/01/uncertainty-of-valuations-of-risk.html and earlier http://cmpassocregulationblog.blogspot.com/2015/12/liftoff-of-interest-rates-with-monetary.html and earlier http://cmpassocregulationblog.blogspot.com/2015/11/interest-rate-liftoff-followed-by.html and earlier http://cmpassocregulationblog.blogspot.com/2015/10/interest-rate-policy-quagmire-world.html and earlier http://cmpassocregulationblog.blogspot.com/2015/09/interest-rate-increase-on-hold-because.html and earlier http://cmpassocregulationblog.blogspot.com/2015/08/global-decline-of-values-of-financial.html and earlier http://cmpassocregulationblog.blogspot.com/2015/07/fluctuating-risk-financial-assets.html and earlier http://cmpassocregulationblog.blogspot.com/2015/06/fluctuating-financial-asset-valuations.html and earlier http://cmpassocregulationblog.blogspot.com/2015/05/interest-rate-policy-and-dollar.html and earlier http://cmpassocregulationblog.blogspot.com/2015/04/global-portfolio-reallocations-squeeze.html and earlier http://cmpassocregulationblog.blogspot.com/2015/03/dollar-revaluation-and-financial-risk.html and earlier http://cmpassocregulationblog.blogspot.com/2015/03/irrational-exuberance-mediocre-cyclical.html and earlier http://cmpassocregulationblog.blogspot.com/2015/01/competitive-currency-conflicts-world.html and earlier http://cmpassocregulationblog.blogspot.com/2014/12/patience-on-interest-rate-increases.html and earlier (http://cmpassocregulationblog.blogspot.com/2014/11/squeeze-of-economic-activity-by-carry.html and earlier http://cmpassocregulationblog.blogspot.com/2014/10/financial-oscillations-world-inflation.html http://cmpassocregulationblog.blogspot.com/2014/09/world-inflation-waves-squeeze-of.html and earlier http://cmpassocregulationblog.blogspot.com/2014/08/monetary-policy-world-inflation-waves.html http://cmpassocregulationblog.blogspot.com/2014/07/world-inflation-waves-united-states.html)
- Deteriorating terms of trade and net revenue margins of production across countries in squeeze of economic activity by carry trades induced by zero interest rates (Section II and earlier https://cmpassocregulationblog.blogspot.com/2017/10/world-inflation-waves-long-term-and.html and earlier https://cmpassocregulationblog.blogspot.com/2017/09/monetary-policy-of-reducing-central.html and earlier https://cmpassocregulationblog.blogspot.com/2017/08/fluctuating-valuations-of-risk.html and earlier https://cmpassocregulationblog.blogspot.com/2017/07/dollar-devaluation-and-valuation-of.html and earlier https://cmpassocregulationblog.blogspot.com/2017/06/fomc-interest-rate-increase-planned.html and earlier https://cmpassocregulationblog.blogspot.com/2017/05/dollar-devaluation-world-inflation.html and earlier https://cmpassocregulationblog.blogspot.com/2017/04/united-states-commercial-banks-assets.html and earlier https://cmpassocregulationblog.blogspot.com/2017/03/fomc-increases-interest-rates-world.html and earlier http://cmpassocregulationblog.blogspot.com/2017/01/world-inflation-waves-united-states.html and earlier http://cmpassocregulationblog.blogspot.com/2016/12/of-course-economic-outlook-is-highly.html and earlier http://cmpassocregulationblog.blogspot.com/2016/11/interest-rate-increase-could-well.html and earlier http://cmpassocregulationblog.blogspot.com/2016/10/dollar-revaluation-world-inflation.html and earlier http://cmpassocregulationblog.blogspot.com/2016/09/interest-rates-and-volatility-of-risk.html and earlier http://cmpassocregulationblog.blogspot.com/2016/07/unresolved-us-balance-of-payments.html and earlier http://cmpassocregulationblog.blogspot.com/2016/06/fomc-projections-world-inflation-waves.html and earlier http://cmpassocregulationblog.blogspot.com/2016/05/most-fomc-participants-judged-that-if.html and earlier http://cmpassocregulationblog.blogspot.com/2016/04/imf-view-of-world-economy-and-finance.html and earlier) (http://cmpassocregulationblog.blogspot.com/2016/03/monetary-policy-and-competitive.html and earlier http://cmpassocregulationblog.blogspot.com/2016/02/squeeze-of-economic-activity-by-carry.html and earlier http://cmpassocregulationblog.blogspot.com/2016/01/uncertainty-of-valuations-of-risk.html and earlier http://cmpassocregulationblog.blogspot.com/2015/12/liftoff-of-interest-rates-with-monetary.html and earlier http://cmpassocregulationblog.blogspot.com/2015/11/interest-rate-liftoff-followed-by.html http://cmpassocregulationblog.blogspot.com/2015/10/interest-rate-policy-quagmire-world.html and earlier http://cmpassocregulationblog.blogspot.com/2015/09/interest-rate-increase-on-hold-because.html and earlier http://cmpassocregulationblog.blogspot.com/2015/08/global-decline-of-values-of-financial.html and earlier http://cmpassocregulationblog.blogspot.com/2015/07/fluctuating-risk-financial-assets.html and earlier http://cmpassocregulationblog.blogspot.com/2015/06/fluctuating-financial-asset-valuations.html and earlier http://cmpassocregulationblog.blogspot.com/2015/04/global-portfolio-reallocations-squeeze.html and earlier http://cmpassocregulationblog.blogspot.com/2015/03/impatience-with-monetary-policy-of.html and earlier http://cmpassocregulationblog.blogspot.com/2015/02/world-financial-turbulence-squeeze-of.html http://cmpassocregulationblog.blogspot.com/2015/01/exchange-rate-conflicts-squeeze-of.html and earlier http://cmpassocregulationblog.blogspot.com/2014/12/patience-on-interest-rate-increases.html and earlier http://cmpassocregulationblog.blogspot.com/2014/11/squeeze-of-economic-activity-by-carry.html and earlier http://cmpassocregulationblog.blogspot.com/2014/10/imf-view-squeeze-of-economic-activity.html and earlier http://cmpassocregulationblog.blogspot.com/2014/09/world-inflation-waves-squeeze-of.html
- Financial repression of interest rates and credit affecting the most people without means and access to sophisticated financial investments with likely adverse effects on income distribution and wealth disparity (https://cmpassocregulationblog.blogspot.com/2017/11/unchanged-fomc-policy-rate-gradual.html and earlier https://cmpassocregulationblog.blogspot.com/2017/10/twenty-one-million-unemployed-or.html and earlier https://cmpassocregulationblog.blogspot.com/2017/09/twenty-two-million-unemployed-or.html and earlier https://cmpassocregulationblog.blogspot.com/2017/08/data-dependent-monetary-policy-with.html and earlier https://cmpassocregulationblog.blogspot.com/2017/07/rising-yields-twenty-two-million.html and earlier https://cmpassocregulationblog.blogspot.com/2017/06/twenty-two-million-unemployed-or.html and earlier https://cmpassocregulationblog.blogspot.com/2017/05/twenty-two-million-unemployed-or.html and earlier (https://cmpassocregulationblog.blogspot.com/2017/04/twenty-three-million-unemployed-or.html and earlier https://cmpassocregulationblog.blogspot.com/2017/03/rising-valuations-of-risk-financial.html and earlier https://cmpassocregulationblog.blogspot.com/2017/02/twenty-six-million-unemployed-or.html and earlier http://cmpassocregulationblog.blogspot.com/2016/12/mediocre-cyclical-united-states.html and earlier http://cmpassocregulationblog.blogspot.com/2016/12/rising-yields-and-dollar-revaluation.html and earlier http://cmpassocregulationblog.blogspot.com/2016/11/the-case-for-increase-in-federal-funds.html and earlier http://cmpassocregulationblog.blogspot.com/2016/11/the-case-for-increase-in-federal-funds.html and earlier http://cmpassocregulationblog.blogspot.com/2016/10/twenty-four-million-unemployed-or.html and earlier http://cmpassocregulationblog.blogspot.com/2016/09/interest-rates-and-valuations-of-risk.html and earlier http://cmpassocregulationblog.blogspot.com/2016/08/global-competitive-easing-or.html and earlier http://cmpassocregulationblog.blogspot.com/2016/07/financial-asset-values-rebound-from.html and earlier http://cmpassocregulationblog.blogspot.com/2016/06/financial-turbulence-twenty-four.html and earlier http://cmpassocregulationblog.blogspot.com/2016/05/twenty-four-million-unemployed-or.html and earlier http://cmpassocregulationblog.blogspot.com/2016/04/proceeding-cautiously-in-monetary.html and earlier http://cmpassocregulationblog.blogspot.com/2016/03/twenty-five-million-unemployed-or.html and earlier http://cmpassocregulationblog.blogspot.com/2016/03/twenty-five-million-unemployed-or.html and earlier http://cmpassocregulationblog.blogspot.com/2016/01/closely-monitoring-global-economic-and.html and earlier http://cmpassocregulationblog.blogspot.com/2015/12/dollar-revaluation-and-decreasing.html and earlier http://cmpassocregulationblog.blogspot.com/2015/11/dollar-revaluation-constraining.html and earlier (http://cmpassocregulationblog.blogspot.com/2015/11/live-possibility-of-interest-rates.html and earlier http://cmpassocregulationblog.blogspot.com/2015/10/labor-market-uncertainty-and-interest.html and earlier http://cmpassocregulationblog.blogspot.com/2015/09/interest-rate-policy-dependent-on-what.html and earlier http://cmpassocregulationblog.blogspot.com/2015/08/fluctuating-risk-financial-assets.html and earlier http://cmpassocregulationblog.blogspot.com/2015/06/international-valuations-of-financial.html and earlier http://cmpassocregulationblog.blogspot.com/2015/06/higher-volatility-of-asset-prices-at.html and earlier http://cmpassocregulationblog.blogspot.com/2015/05/dollar-devaluation-and-carry-trade.html and earlier http://cmpassocregulationblog.blogspot.com/2015/04/volatility-of-valuations-of-financial.html and earlier http://cmpassocregulationblog.blogspot.com/2015/03/global-competitive-devaluation-rules.html and earlier http://cmpassocregulationblog.blogspot.com/2015/02/job-creation-and-monetary-policy-twenty.html and earlier (http://cmpassocregulationblog.blogspot.com/2014/12/valuations-of-risk-financial-assets.html and earlier http://cmpassocregulationblog.blogspot.com/2014/11/valuations-of-risk-financial-assets.html and earlier http://cmpassocregulationblog.blogspot.com/2014/11/growth-uncertainties-mediocre-cyclical.html and earlier http://cmpassocregulationblog.blogspot.com/2014/10/world-financial-turbulence-twenty-seven.html)
- 43 million in poverty and 29 million without health insurance with family income adjusted for inflation regressing to 1999 levels (http://cmpassocregulationblog.blogspot.com/2016/09/the-economic-outlook-is-inherently.html and earlier http://cmpassocregulationblog.blogspot.com/2015/10/interest-rate-policy-uncertainty-imf.html and earlier http://cmpassocregulationblog.blogspot.com/2014/09/financial-volatility-mediocre-cyclical.html and earlier http://cmpassocregulationblog.blogspot.com/2013/09/duration-dumping-and-peaking-valuations.html)
- Net worth of households and nonprofits organizations increasing by 23.6 percent after adjusting for inflation in the entire cycle from IVQ2007 to IIQ2017 when it would have grown over 33.6 percent at trend of 3.1 percent per year in real terms from IVQ1945 to IIQ2017 (https://cmpassocregulationblog.blogspot.com/2017/10/destruction-of-household-nonfinancial.html and earlier https://cmpassocregulationblog.blogspot.com/2017/06/united-states-commercial-banks-united.html and earlier (https://cmpassocregulationblog.blogspot.com/2017/03/recovery-without-hiring-ten-million.html and earlier http://cmpassocregulationblog.blogspot.com/2017/01/rules-versus-discretionary-authorities.html and earlier http://cmpassocregulationblog.blogspot.com/2016/09/the-economic-outlook-is-inherently.html and earlier http://cmpassocregulationblog.blogspot.com/2016/06/of-course-considerable-uncertainty.html and earlier http://cmpassocregulationblog.blogspot.com/2016/03/monetary-policy-and-fluctuations-of_13.html and earlier http://cmpassocregulationblog.blogspot.com/2016/01/weakening-equities-and-dollar.html and earlier http://cmpassocregulationblog.blogspot.com/2015/09/monetary-policy-designed-on-measurable.html and earlier http://cmpassocregulationblog.blogspot.com/2015/06/fluctuating-financial-asset-valuations.html and earlier http://cmpassocregulationblog.blogspot.com/2015/03/dollar-revaluation-and-financial-risk.html and earlier http://cmpassocregulationblog.blogspot.com/2014/12/valuations-of-risk-financial-assets.html and earlier http://cmpassocregulationblog.blogspot.com/2014/09/financial-volatility-mediocre-cyclical.html and earlier http://cmpassocregulationblog.blogspot.com/2014/06/financial-indecision-mediocre-cyclical.html and earlier http://cmpassocregulationblog.blogspot.com/2014/03/global-financial-risks-recovery-without.html and earlier http://cmpassocregulationblog.blogspot.com/2013/12/collapse-of-united-states-dynamism-of.html). Financial assets increased $25.2 trillion while nonfinancial assets increased $5.0 trillion with likely concentration of wealth in those with access to sophisticated financial investments. Real estate assets adjusted for inflation fell 0.1 percent.
Industrial production increased 0.9 percent in Oct 2017 and increased 0.4 percent in Sep 2017 after decreasing 0.5 percent in Aug 2017, with all data seasonally adjusted, as shown in Table I-1. The Board of Governors of the Federal Reserve System conducted the annual revision of industrial production released on Mar 31, 2017 (https://www.federalreserve.gov/releases/g17/revisions/Current/DefaultRev.htm):
“The Federal Reserve has revised its index of industrial production (IP) and the related measures of capacity and capacity utilization.[1] On net, the revisions were small, and the contour of total IP is little changed. Total IP is still reported to have moved up about 22 percent from the end of the recession in mid-2009 through late 2014, to have declined in 2015, and to have moved sideways in 2016. The most notable difference between the current and the previous estimates is that total IP is now reported to have decreased about 2 3/4 percent in 2015, whereas it previously showed a decline of about 1 3/4 percent.[2] The incorporation of detailed data for manufacturing from the U.S. Census Bureau's 2015 Annual Survey of Manufactures (ASM) accounts for the majority of the differences between the current and the previously published estimates.
Capacity for total industry is now reported to have expanded about 1 percent in 2015, a lower rate of increase than was reported earlier. Capacity was little changed in 2016 and is expected to increase 1 percent in 2017. Compared with prior reports, the rates of change in 2016 and 2017 are now a little smaller.
In the fourth quarter of 2016, capacity utilization for total industry stood at 75.8 percent, a rate 0.4 percentage point higher than previously published but still 4.1 percentage points below its long-run (1972–2016) average. Relative to earlier estimates, the utilization rates in recent years are now a little higher.”
The report of the Board of Governors of the Federal Reserve System states (https://www.federalreserve.gov/releases/g17/Current/default.htm):
“Industrial production rose 0.9 percent in October, and manufacturing increased 1.3 percent. The index for utilities rose 2.0 percent, but mining output fell 1.3 percent, as Hurricane Nate caused a sharp but short-lived decline in oil and gas drilling and extraction. Even so, industrial activity was boosted in October by a return to normal operations after Hurricanes Harvey and Irma suppressed production in August and September.[1] Excluding the effects of the hurricanes, the index for total output advanced about 0.3 percent in October, and the index for manufacturing advanced about 0.2 percent.
With modest upward revisions for July through September, industrial production is now estimated to have only edged down 0.3 percent at an annual rate in the third quarter; the previously published estimate showed a decrease of 1.5 percent.
Total industrial production has risen 2.9 percent over the past 12 months; output in October was 106.1 percent of its 2012 average. Capacity utilization for the industrial sector was 77.0 percent, a rate that is 2.9 percentage points below its long-run (1972–2016) average.” In the six months ending in Oct 2017, United States national industrial production accumulated change of 1.0 percent at the annual equivalent rate of 2.0 percent, which is lower than growth of 2.9 percent in the 12 months ending in Oct 2017. Excluding growth of 0.9 percent in Oct 2017, growth in the remaining five months from May to Oct 2017 accumulated to 0.1 percent or 0.2 percent annual equivalent. Industrial production increased 0.9 percent in one of the past six months, increased 0.4 percent in one month and 0.2 percent in another month, decreased 0.5 percent in one month, changing 0.0 percent in two months. Industrial production increased at annual equivalent 3.2 percent in the most recent quarter from Aug 2017 to Oct and increased at 0.8 percent in the prior quarter May 2017 to Jul 2017. Business equipment accumulated change of minus 0.1 percent in the six months from May 2017 to Oct 2017, at the annual equivalent rate of minus 0.2 percent, which is lower than growth of 4.2 percent in the 12 months ending in Oct 2017. The Fed analyzes capacity utilization of total industry in its report (https://www.federalreserve.gov/releases/g17/Current/default.htm): “Capacity utilization for the industrial sector was 77.0 percent, a rate that is 2.9 percentage points below its long-run (1972–2016) average.” United States industry apparently decelerated to a lower growth rate followed by possible acceleration and weakening growth in past months. There could be renewed growth.
Table I-1, US, Industrial Production and Capacity Utilization, SA, ∆%
| Oct 17 | Sep 17 | Aug 17 | Jul 17 | Jun 16 | May 17 | Oct 17/ Oct 16 | |
| Total | 0.9 | 0.4 | -0.5 | 0.0 | 0.2 | 0.0 | 2.9 |
| Market | |||||||
| Final Products | 0.7 | 0.7 | 0.0 | -0.2 | -0.1 | 0.1 | 2.8 |
| Consumer Goods | 0.9 | 0.5 | 0.0 | 0.1 | -0.3 | 0.4 | 1.8 |
| Business Equipment | 0.5 | 1.5 | 0.0 | -1.0 | -0.1 | -1.0 | 4.2 |
| Non | 0.5 | 0.7 | -0.7 | 0.1 | -0.3 | -0.2 | 1.7 |
| Construction | 0.4 | 1.7 | -0.8 | 0.0 | -0.4 | -0.8 | 3.2 |
| Materials | 1.3 | 0.0 | -0.8 | 0.1 | 0.6 | 0.0 | 3.4 |
| Industry Groups | |||||||
| Manufacturing | 1.3 | 0.4 | -0.2 | -0.2 | 0.1 | -0.5 | 2.5 |
| Mining | -1.3 | 1.5 | -1.2 | 0.5 | 1.2 | 0.8 | 6.4 |
| Utilities | 2.0 | -1.0 | -1.3 | 0.5 | -1.0 | 2.7 | 0.9 |
| Capacity | 77.0 | 76.4 | 76.1 | 76.5 | 76.6 | 76.6 | 1.2 |
Sources: Board of Governors of the Federal Reserve System
https://www.federalreserve.gov/releases/g17/Current/default.htm
Manufacturing increased 1.3 percent in Oct 2017 and increased 0.4 percent in Sep 2017 after decreasing 0.2 percent in Aug 2017, seasonally adjusted, increasing 2.5 percent not seasonally adjusted in the 12 months ending in Oct 2017, as shown in Table I-2. Manufacturing increased cumulatively 0.9 percent in the six months ending in Oct 2017 or at the annual equivalent rate of 1.8 percent. Excluding the increase of 1.3 percent in Oct 2017, manufacturing decreased 0.4 percent from May 2017 to Oct 2017 or at the annual equivalent rate of minus 1.0 percent. Table I-2 provides a longer perspective of manufacturing in the US. There has been evident deceleration of manufacturing growth in the US from 2010 and the first three months of 2011 with recovery followed by renewed deterioration/improvement in more recent months as shown by 12 months’ rates of growth. Growth rates appeared to be increasing again closer to 5 percent in Apr-Jun 2012 but deteriorated. The rates of decline of manufacturing in 2009 are quite high with a drop of 18.5 percent in the 12 months ending in Apr 2009. Manufacturing recovered from this decline and led the recovery from the recession. Rates of growth appeared to be returning to the levels at 3 percent or higher in the annual rates before the recession, but the pace of manufacturing fell steadily with some strength at the margin. There is renewed deterioration and improvement. The Board of Governors of the Federal Reserve System conducted the annual revision of industrial production released on Mar 31, 2017 (https://www.federalreserve.gov/releases/g17/revisions/Current/DefaultRev.htm):
“The Federal Reserve has revised its index of industrial production (IP) and the related measures of capacity and capacity utilization.[1] On net, the revisions were small, and the contour of total IP is little changed. Total IP is still reported to have moved up about 22 percent from the end of the recession in mid-2009 through late 2014, to have declined in 2015, and to have moved sideways in 2016. The most notable difference between the current and the previous estimates is that total IP is now reported to have decreased about 2 3/4 percent in 2015, whereas it previously showed a decline of about 1 3/4 percent.[2] The incorporation of detailed data for manufacturing from the U.S. Census Bureau's 2015 Annual Survey of Manufactures (ASM) accounts for the majority of the differences between the current and the previously published estimates.
Capacity for total industry is now reported to have expanded about 1 percent in 2015, a lower rate of increase than was reported earlier. Capacity was little changed in 2016 and is expected to increase 1 percent in 2017. Compared with prior reports, the rates of change in 2016 and 2017 are now a little smaller. In the fourth quarter of 2016, capacity utilization for total industry stood at 75.8 percent, a rate 0.4 percentage point higher than previously published but still 4.1 percentage points below its long-run (1972–2016) average. Relative to earlier estimates, the utilization rates in recent years are now a little higher.”
The bottom part of Table I-2 shows manufacturing decreasing 22.3 from the peak in Jun 2007 to the trough in Apr 2009 and increasing 15.5 percent from the trough in Apr 2009 to Dec 2016. Manufacturing grew 21.4 percent from the trough in Apr 2009 to Oct 2017. Manufacturing in Oct 2017 is lower by 5.7 percent relative to the peak in Jun 2007. The US maintained growth at 3.0 percent on average over entire cycles with expansions at higher rates compensating for contractions. US economic growth has been at only 2.2 percent on average in the cyclical expansion in the 33 quarters from IIIQ2009 to IIIQ2017. Boskin (2010Sep) measures that the US economy grew at 6.2 percent in the first four quarters and 4.5 percent in the first 12 quarters after the trough in the second quarter of 1975; and at 7.7 percent in the first four quarters and 5.8 percent in the first 12 quarters after the trough in the first quarter of 1983 (Professor Michael J. Boskin, Summer of Discontent, Wall Street Journal, Sep 2, 2010 http://professional.wsj.com/article/SB10001424052748703882304575465462926649950.html). There are new calculations using the revision of US GDP and personal income data since 1929 by the Bureau of Economic Analysis (BEA) (http://bea.gov/iTable/index_nipa.cfm) and the first estimate of GDP for IIIQ2017 (https://www.bea.gov/newsreleases/national/gdp/2017/pdf/gdp3q17_adv.pdf). The average of 7.7 percent in the first four quarters of major cyclical expansions is in contrast with the rate of growth in the first four quarters of the expansion from IIIQ2009 to IIQ2010 of only 2.7 percent obtained by dividing GDP of $14,745.9 billion in IIQ2010 by GDP of $14,355.6 billion in IIQ2009 {[($14,745.9/$14,355.6) -1]100 = 2.7%], or accumulating the quarter on quarter growth rates (https://cmpassocregulationblog.blogspot.com/2017/10/dollar-revaluation-and-increase-of.html). The expansion from IQ1983 to IVQ1985 was at the average annual growth rate of 5.9 percent, 5.4 percent from IQ1983 to IIIQ1986, 5.2 percent from IQ1983 to IVQ1986, 5.0 percent from IQ1983 to IQ1987, 5.0 percent from IQ1983 to IIQ1987, 4.9 percent from IQ1983 to IIIQ1987, 5.0 percent from IQ1983 to IVQ1987, 4.9 percent from IQ1983 to IIQ1988, 4.8 percent from IQ1983 to IIIQ1988, 4.8 percent from IQ1983 to IVQ1988, 4.8 percent from IQ1983 to IQ1989, 4.7 percent from IQ1983 to IIQ1989, 4.7 percent from IQ1983 to IIIQ1989, 4.5 percent from IQ1983 to IVQ1989. 4.5 percent from IQ1983 to IQ1990, 4.4 percent from IQ1983 to IIQ1990, 4.3 percent from IQ1983 to IIIQ1990, 4.0 percent from IQ1983 to IVQ1990, 3.8 percent from IQ1983 to IQ1991 and at 7.8 percent from IQ1983 to IVQ1983 (https://cmpassocregulationblog.blogspot.com/2017/10/dollar-revaluation-and-increase-of.html). The National Bureau of Economic Research (NBER) dates a contraction of the US from IQ1990 (Jul) to IQ1991 (Mar) (http://www.nber.org/cycles.html). The expansion lasted until another contraction beginning in IQ2001 (Mar). US GDP contracted 1.3 percent from the pre-recession peak of $8983.9 billion of chained 2009 dollars in IIIQ1990 to the trough of $8865.6 billion in IQ1991 (http://www.bea.gov/iTable/index_nipa.cfm). The US maintained growth at 3.0 percent on average over entire cycles with expansions at higher rates compensating for contractions. Growth at trend in the entire cycle from IVQ2007 to IIIQ2017 would have accumulated to 33.4 percent. GDP in IIIQ2017 would be $19,999.1 billion (in constant dollars of 2009) if the US had grown at trend, which is higher by $2842.2 billion than actual $17,156.9 billion. There are about two trillion dollars of GDP less than at trend, explaining the 21.2 million unemployed or underemployed equivalent to actual unemployment/underemployment of 12.5 percent of the effective labor force (https://cmpassocregulationblog.blogspot.com/2017/11/unchanged-fomc-policy-rate-gradual.html and earlier https://cmpassocregulationblog.blogspot.com/2017/10/twenty-one-million-unemployed-or.html). US GDP in IIIQ2017 is 14.2 percent lower than at trend. US GDP grew from $14,991.8 billion in IVQ2007 in constant dollars to $17,156.9 billion in IIIQ2017 or 14.4 percent at the average annual equivalent rate of 1.4 percent. Professor John H. Cochrane (2014Jul2) estimates US GDP at more than 10 percent below trend. Cochrane (2016May02) measures GDP growth in the US at average 3.5 percent per year from 1950 to 2000 and only at 1.76 percent per year from 2000 to 2015 with only at 2.0 percent annual equivalent in the current expansion. Cochrane (2016May02) proposes drastic changes in regulation and legal obstacles to private economic activity. The US missed the opportunity to grow at higher rates during the expansion and it is difficult to catch up because growth rates in the final periods of expansions tend to decline. The US missed the opportunity for recovery of output and employment always afforded in the first four quarters of expansion from recessions. Zero interest rates and quantitative easing were not required or present in successful cyclical expansions and in secular economic growth at 3.0 percent per year and 2.0 percent per capita as measured by Lucas (2011May). There is cyclical uncommonly slow growth in the US instead of allegations of secular stagnation. There is similar behavior in manufacturing. There is classic research on analyzing deviations of output from trend (see for example Schumpeter 1939, Hicks 1950, Lucas 1975, Sargent and Sims 1977). The long-term trend is growth of manufacturing at average 3.1 percent per year from Oct 1919 to Oct 2017. Growth at 3.1 percent per year would raise the NSA index of manufacturing output from 108.2393 in Dec 2007 to 146.1374 in Oct 2017. The actual index NSA in Oct 2017 is 106.1414, which is 27.4 percent below trend. Manufacturing output grew at average 2.1 percent between Dec 1986 and Oct 2017. Using trend growth of 2.1 percent per year, the index would increase to 132.7816 in Oct 2017. The output of manufacturing at 106.1414 in Oct 2017 is 20.1 percent below trend under this alternative calculation.
Table I-2, US, Monthly and 12-Month Rates of Growth of Manufacturing ∆%
| Month SA ∆% | 12-Month NSA ∆% | |
| Oct 2017 | 1.3 | 2.5 |
| Sep | 0.4 | 1.4 |
| Aug | -0.2 | 1.3 |
| Jul | -0.2 | 1.5 |
| Jun | 0.1 | 1.4 |
| May | -0.5 | 1.6 |
| Apr | 1.3 | 0.1 |
| Mar | -0.7 | 1.0 |
| Feb | 0.3 | 0.9 |
| Jan | 0.4 | 0.4 |
| Dec 2016 | 0.2 | 0.6 |
| Nov | 0.2 | 0.1 |
| Oct | 0.2 | 0.0 |
| Sep | 0.2 | 0.3 |
| Aug | -0.4 | -0.8 |
| Jul | 0.1 | -0.5 |
| Jun | 0.2 | 0.2 |
| May | -0.2 | -0.3 |
| Apr | 0.0 | 0.5 |
| Mar | -0.2 | -0.7 |
| Feb | -0.2 | 0.4 |
| Jan | 0.6 | 0.2 |
| Dec 2015 | -0.3 | -0.9 |
| Nov | -0.1 | -0.7 |
| Oct | 0.2 | 0.2 |
| Sep | -0.3 | -0.8 |
| Aug | -0.1 | 0.1 |
| Jul | 0.6 | 0.3 |
| Jun | -0.3 | -0.6 |
| May | -0.1 | 0.2 |
| Apr | 0.1 | 0.3 |
| Mar | 0.3 | 0.3 |
| Feb | -0.5 | 0.7 |
| Jan | -0.4 | 2.1 |
| Dec 2014 | -0.4 | 1.7 |
| Nov | 0.9 | 1.9 |
| Oct | 0.0 | 1.1 |
| Sep | 0.0 | 1.2 |
| Aug | -0.4 | 1.4 |
| Jul | 0.2 | 2.0 |
| Jun | 0.3 | 1.5 |
| May | 0.2 | 1.3 |
| Apr | 0.0 | 0.9 |
| Mar | 0.8 | 1.5 |
| Feb | 1.1 | 0.2 |
| Jan | -1.0 | -0.7 |
| Dec 2013 | 0.0 | 0.0 |
| Nov | 0.0 | 1.0 |
| Oct | 0.1 | 1.7 |
| Sep | 0.1 | 1.1 |
| Aug | 1.0 | 1.3 |
| Jul | -1.1 | 0.2 |
| Jun | 0.2 | 0.7 |
| May | 0.2 | 0.9 |
| Apr | -0.4 | 1.1 |
| Mar | -0.2 | 0.7 |
| Feb | 0.5 | 0.9 |
| Jan | -0.3 | 1.0 |
| Dec 2012 | 0.7 | 2.0 |
| Nov | 0.8 | 2.0 |
| Oct | -0.2 | 0.9 |
| Sep | 0.0 | 1.7 |
| Aug | -0.2 | 2.2 |
| Jul | -0.1 | 2.5 |
| Jun | 0.2 | 3.3 |
| May | -0.4 | 3.2 |
| Apr | 0.6 | 3.6 |
| Mar | -0.5 | 2.5 |
| Feb | 0.4 | 3.8 |
| Jan | 0.9 | 3.2 |
| Dec 2011 | 0.6 | 2.8 |
| Nov | -0.4 | 2.3 |
| Oct | 0.6 | 2.5 |
| Sep | 0.3 | 2.3 |
| Aug | 0.4 | 1.9 |
| Jul | 0.5 | 2.2 |
| Jun | 0.1 | 1.8 |
| May | 0.1 | 1.6 |
| Apr | -0.6 | 2.9 |
| Mar | 0.6 | 4.5 |
| Feb | 0.1 | 5.1 |
| Jan | 0.2 | 5.2 |
| Dec 2010 | 0.4 | 5.8 |
| Nov | 0.0 | 4.9 |
| Oct | 0.1 | 6.1 |
| Sep | 0.1 | 6.4 |
| Aug | 0.2 | 7.0 |
| Jul | 0.6 | 7.5 |
| Jun | -0.1 | 9.2 |
| May | 1.4 | 8.7 |
| Apr | 0.9 | 6.9 |
| Mar | 1.2 | 4.6 |
| Feb | -0.1 | 1.2 |
| Jan | 1.1 | 1.1 |
| Dec 2009 | -0.2 | -3.4 |
| Nov | 1.0 | -6.3 |
| Oct | 0.2 | -9.3 |
| Sep | 0.8 | -10.7 |
| Aug | 1.2 | -13.7 |
| Jul | 1.4 | -15.4 |
| Jun | -0.4 | -18.0 |
| May | -1.1 | -17.8 |
| Apr | -0.8 | -18.5 |
| Mar | -1.9 | -17.4 |
| Feb | -0.2 | -16.3 |
| Jan | -3.0 | -16.6 |
| Dec 2008 | -3.5 | -14.1 |
| Nov | -2.3 | -11.4 |
| Oct | -0.6 | -8.9 |
| Sep | -3.4 | -8.7 |
| Aug | -1.1 | -5.2 |
| Jul | -1.2 | -3.7 |
| Jun | -0.6 | -3.3 |
| May | -0.5 | -2.6 |
| Apr | -1.1 | -1.3 |
| Mar | -0.3 | -0.8 |
| Feb | -0.6 | 0.8 |
| Jan | -0.4 | 2.1 |
| Dec 2007 | 0.1 | 1.8 |
| Nov | 0.5 | 3.3 |
| Oct | -0.4 | 2.7 |
| Sep | 0.4 | 2.9 |
| Aug | -0.3 | 2.7 |
| Jul | 0.1 | 3.6 |
| Jun | 0.3 | 3.1 |
| May | -0.1 | 3.2 |
| Apr | 0.7 | 3.7 |
| Mar | 0.8 | 2.6 |
| Feb | 0.4 | 1.6 |
| Jan | -0.5 | 1.3 |
| Dec 2006 | 2.7 | |
| Dec 2005 | 3.5 | |
| Dec 2004 | 4.0 | |
| Dec 2003 | 2.2 | |
| Dec 2002 | 2.4 | |
| Dec 2001 | -5.4 | |
| Dec 2000 | 0.8 | |
| Dec 1999 | 5.2 | |
| Average ∆% Dec 1986-Dec 2016 | 2.0 | |
| Average ∆% Dec 1986-Dec 2015 | 2.0 | |
| Average ∆% Dec 1986-Dec 2014 | 2.1 | |
| Average ∆% Dec 1986-Dec 2013 | 2.2 | |
| Average ∆% Dec 1986-Dec 1999 | 4.3 | |
| Average ∆% Dec 1999-Dec 2006 | 1.4 | |
| Average ∆% Dec 1999-Dec 2016 | 0.3 | |
| ∆% Peak 112.5742 in 06/2007 to 100.9324 in 12/2016 | -10.3 | |
| ∆% Peak 112.5742 in 06/2007 to Trough 87.4229 in 4/2009 | -22.3 | |
| ∆% Trough 87.4229 in 04/2009 to 100.9324 in 12/2016 | 15.5 | |
| ∆% Trough 87.4229 in 04/2009 to 106.1414 in 10/2017 | 21.4 | |
| ∆% Peak 112.5742 on 06/2007 to 106.1414 in 10/2017 | -5.7 |
Source: Board of Governors of the Federal Reserve System
https://www.federalreserve.gov/releases/g17/Current/default.htm
Chart I-1 of the Board of Governors of the Federal Reserve System provides industrial production, manufacturing and capacity since the 1970s. There was acceleration of growth of industrial production, manufacturing and capacity in the 1990s because of rapid growth of productivity in the US (Cobet and Wilson (2002); see Pelaez and Pelaez, The Global Recession Risk (2007), 135-44). The slopes of the curves flatten in the 2000s. Production and capacity have not recovered sufficiently above levels before the global recession, remaining like GDP below historical trend. There is classic research on analyzing deviations of output from trend (see for example Schumpeter 1939, Hicks 1950, Lucas 1975, Sargent and Sims 1977). The long-term trend is growth of manufacturing at average 3.1 percent per year from Jul 1919 to Jul 2017. Growth at 3.1 percent per year would raise the NSA index of manufacturing output from 108.2393 in Dec 2007 to 145.0407 in Jul 2017. The actual index NSA in Jul 2017 is 102.1551, which is 29.6 percent below trend. Manufacturing output grew at average 2.0 percent between Dec 1986 and Jul 2017. Using trend growth of 2.0 percent per year, the index would increase to 130.8588 in Jul 2017. The output of manufacturing at 102.1551 in Jul 2017 is 21.9 percent below trend under this alternative calculation.
Chart I-1, US, Industrial Production, Capacity and Utilization
Source: Board of Governors of the Federal Reserve System
https://www.federalreserve.gov/releases/g17/Current/ipg1.gif
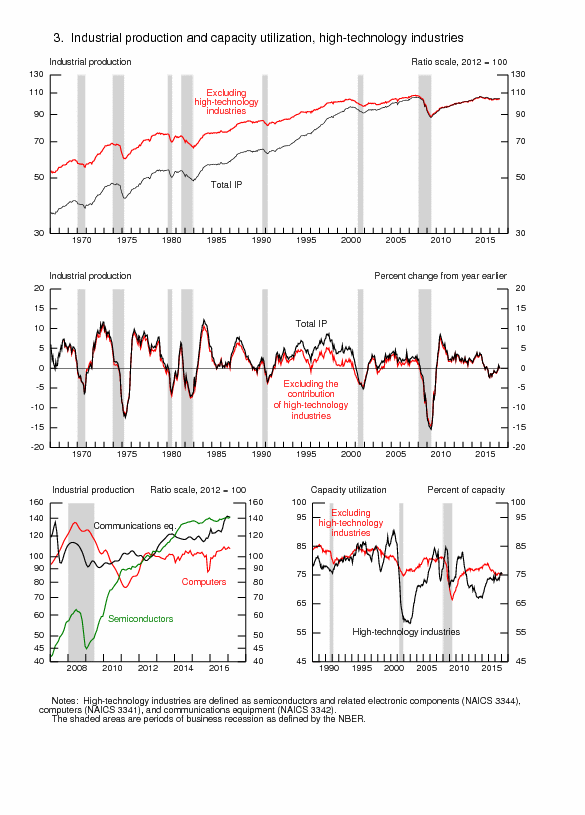
The modern industrial revolution of Jensen (1993) is captured in Chart I-2 of the Board of Governors of the Federal Reserve System (for the literature on M&A and corporate control see Pelaez and Pelaez, Regulation of Banks and Finance (2009a), 143-56, Globalization and the State, Vol. I (2008a), 49-59, Government Intervention in Globalization (2008c), 46-49). The slope of the curve of total industrial production accelerates in the 1990s to a much higher rate of growth than the curve excluding high-technology industries. Growth rates decelerate into the 2000s and output and capacity utilization have not recovered fully from the strong impact of the global recession. Growth in the current cyclical expansion has been more subdued than in the prior comparably deep contractions in the 1970s and 1980s. Chart I-2 shows that the past recessions after World War II are the relevant ones for comparison with the recession after 2007 instead of common comparisons with the Great Depression (https://cmpassocregulationblog.blogspot.com/2017/10/destruction-of-household-nonfinancial.html and earlier https://cmpassocregulationblog.blogspot.com/2017/09/mediocre-cyclical-united-states.html)). The bottom left-hand part of Chart II-2 shows the strong growth of output of communication equipment, computers and semiconductor that continued from the 1990s into the 2000s. Output of semiconductors has already surpassed the level before the global recession.
Chart I-2, US, Industrial Production, Capacity and Utilization of High Technology Industries
Source: Board of Governors of the Federal Reserve System
https://www.federalreserve.gov/releases/g17/Current/ipg3.gif
Additional detail on industrial production and capacity utilization is in Chart I-3 of the Board of Governors of the Federal Reserve System. Production of consumer durable goods fell sharply during the global recession by more than 30 percent and is oscillating above the level before the contraction. Output of nondurable consumer goods fell around 10 percent and is some 5 percent below the level before the contraction. Output of business equipment fell sharply during the contraction of 2001 but began rapid growth again after 2004. An important characteristic is rapid growth of output of business equipment in the cyclical expansion after sharp contraction in the global recession, stalling in the final segment. Output of defense and space only suffered reduction in the rate of growth during the global recession and surged ahead of the level before the contraction, declining in the final segment. Output of construction supplies collapsed during the global recession and is well below the level before the contraction. Output of energy materials was stagnant before the contraction but recovered sharply above the level before the contraction with recent decline.
Chart I-3, US, Industrial Production and Capacity Utilization
Source: Board of Governors of the Federal Reserve System
https://www.federalreserve.gov/releases/g17/Current/ipg2.gif
United States manufacturing output from 1919 to 2017 on a monthly basis is in Chart I-4 of the Board of Governors of the Federal Reserve System. The second industrial revolution of Jensen (1993) is quite evident in the acceleration of the rate of growth of output given by the sharper slope in the 1980s and 1990s. Growth was robust after the shallow recession of 2001 but dropped sharply during the global recession after IVQ2007. Manufacturing output recovered sharply but has not reached earlier levels and is losing momentum at the margin. Current output is well below extrapolation of trend. There is classic research on analyzing deviations of output from trend (see for example Schumpeter 1939, Hicks 1950, Lucas 1975, Sargent and Sims 1977). The long-term trend is growth of manufacturing at average 3.1 percent per year from Oct 1919 to Oct 2017. Growth at 3.1 percent per year would raise the NSA index of manufacturing output from 108.2393 in Dec 2007 to 146.1374 in Oct 2017. The actual index NSA in Oct 2017 is 106.1414, which is 27.4 percent below trend. Manufacturing output grew at average 2.1 percent between Dec 1986 and Oct 2017. Using trend growth of 2.1 percent per year, the index would increase to 132.7816 in Oct 2017. The output of manufacturing at 106.1414 in Oct 2017 is 20.1 percent below trend under this alternative calculation.
Chart I-4, US, Manufacturing Output, 1919-2017
Source: Board of Governors of the Federal Reserve System
https://www.federalreserve.gov/releases/g17/Current/default.htm
Manufacturing jobs not seasonally adjusted increased 150,000 from Oct 2016 to
Oct 2017 or at the average monthly rate of 12,500. Industrial production increased 0.3 percent in Sep 2017 and decreased 0.7 percent in Aug 2017 after decreasing 0.7 percent in Jul 2017, with all data seasonally adjusted. The Board of Governors of the Federal Reserve System conducted the annual revision of industrial production released on Mar 31, 2017 (https://www.federalreserve.gov/releases/g17/revisions/Current/DefaultRev.htm):
“The Federal Reserve has revised its index of industrial production (IP) and the related measures of capacity and capacity utilization.[1] On net, the revisions were small, and the contour of total IP is little changed. Total IP is still reported to have moved up about 22 percent from the end of the recession in mid-2009 through late 2014, to have declined in 2015, and to have moved sideways in 2016. The most notable difference between the current and the previous estimates is that total IP is now reported to have decreased about 2 3/4 percent in 2015, whereas it previously showed a decline of about 1 3/4 percent.[2] The incorporation of detailed data for manufacturing from the U.S. Census Bureau's 2015 Annual Survey of Manufactures (ASM) accounts for the majority of the differences between the current and the previously published estimates.
Capacity for total industry is now reported to have expanded about 1 percent in 2015, a lower rate of increase than was reported earlier. Capacity was little changed in 2016 and is expected to increase 1 percent in 2017. Compared with prior reports, the rates of change in 2016 and 2017 are now a little smaller. In the fourth quarter of 2016, capacity utilization for total industry stood at 75.8 percent, a rate 0.4 percentage point higher than previously published but still 4.1 percentage points below its long-run (1972–2016) average. Relative to earlier estimates, the utilization rates in recent years are now a little higher.” Manufacturing decreased 22.3 from the peak in Jun 2007 to the trough in Apr 2009 and increased 15.5 percent from the trough in Apr 2009 to Dec 2016. Manufacturing grew 21.4 percent from the trough in Apr 2009 to Oct 2017. Manufacturing in Oct 2017 is lower by 5.7 percent relative to the peak in Jun 2007. The US maintained growth at 3.0 percent on average over entire cycles with expansions at higher rates compensating for contractions. Growth at trend in the entire cycle from IVQ2007 to IIIQ2017 would have accumulated to 33.4 percent. GDP in IIIQ2017 would be $19,999.1 billion (in constant dollars of 2009) if the US had grown at trend, which is higher by $2842.2 billion than actual $17,156.9 billion. There are about two trillion dollars of GDP less than at trend, explaining the 21.2 million unemployed or underemployed equivalent to actual unemployment/underemployment of 12.5 percent of the effective labor force (https://cmpassocregulationblog.blogspot.com/2017/11/unchanged-fomc-policy-rate-gradual.html and earlier https://cmpassocregulationblog.blogspot.com/2017/10/twenty-one-million-unemployed-or.html). US GDP in IIIQ2017 is 14.2 percent lower than at trend. US GDP grew from $14,991.8 billion in IVQ2007 in constant dollars to $17,156.9 billion in IIIQ2017 or 14.4 percent at the average annual equivalent rate of 1.4 percent. Professor John H. Cochrane (2014Jul2) estimates US GDP at more than 10 percent below trend. Cochrane (2016May02) measures GDP growth in the US at average 3.5 percent per year from 1950 to 2000 and only at 1.76 percent per year from 2000 to 2015 with only at 2.0 percent annual equivalent in the current expansion. Cochrane (2016May02) proposes drastic changes in regulation and legal obstacles to private economic activity. The US missed the opportunity to grow at higher rates during the expansion and it is difficult to catch up because growth rates in the final periods of expansions tend to decline. The US missed the opportunity for recovery of output and employment always afforded in the first four quarters of expansion from recessions. Zero interest rates and quantitative easing were not required or present in successful cyclical expansions and in secular economic growth at 3.0 percent per year and 2.0 percent per capita as measured by Lucas (2011May). There is cyclical uncommonly slow growth in the US instead of allegations of secular stagnation. There is similar behavior in manufacturing. There is classic research on analyzing deviations of output from trend (see for example Schumpeter 1939, Hicks 1950, Lucas 1975, Sargent and Sims 1977). The long-term trend is growth of manufacturing at average 3.1 percent per year from Oct 1919 to Oct 2017. Growth at 3.1 percent per year would raise the NSA index of manufacturing output from 108.2393 in Dec 2007 to 146.1374 in Oct 2017. The actual index NSA in Oct 2017 is 106.1414, which is 27.4 percent below trend. Manufacturing output grew at average 2.1 percent between Dec 1986 and Oct 2017. Using trend growth of 2.1 percent per year, the index would increase to 132.7816 in Oct 2017. The output of manufacturing at 106.1414 in Oct 2017 is 20.1 percent below trend under this alternative calculation.
Table I-13 provides national income by industry without capital consumption adjustment (WCCA). “Private industries” or economic activities have share of 87.1 percent in IIQ2017. Most of US national income is in the form of services. In Oct 2017, there were 148.006 million nonfarm jobs NSA in the US, according to estimates of the establishment survey of the Bureau of Labor Statistics (BLS) (http://www.bls.gov/news.release/empsit.nr0.htm Table B-1). Total private jobs of 125.272 million NSA in Oct 2017 accounted for 84.6 percent of total nonfarm jobs of 148.006 million, of which 12.499 million, or 10.0 percent of total private jobs and 8.4 percent of total nonfarm jobs, were in manufacturing. Private service-providing jobs were 104.917 million NSA in Oct 2017, or 70.9 percent of total nonfarm jobs and 83.8 percent of total private-sector jobs. Manufacturing has share of 10.1 percent in US national income in IIQ2017 and durable goods 5.9 percent, as shown in Table I-13. Most income in the US originates in services. Subsidies and similar measures designed to increase manufacturing jobs will not increase economic growth and employment and may actually reduce growth by diverting resources away from currently employment-creating activities because of the drain of taxation.
Table I-13, US, National Income without Capital Consumption Adjustment by Industry, Seasonally Adjusted Annual Rates, Billions of Dollars, % of Total
| SAAR IQ2017 | % Total | SAAR IIQ2017 | % Total | |
| National Income WCCA | 16,281.6 | 100.0 | 16,426.5 | 100.0 |
| Domestic Industries | 16,067.4 | 98.7 | 16,224.1 | 98.8 |
| Private Industries | 14,157.8 | 87.0 | 14,303.4 | 87.1 |
| Agriculture | 134.1 | 0.8 | 114.9 | 0.7 |
| Mining | 142.0 | 0.9 | 156.8 | 1.0 |
| Utilities | 195.2 | 1.2 | 196.6 | 1.2 |
| Construction | 815.9 | 5.0 | 817.2 | 5.0 |
| Manufacturing | 1630.1 | 10.0 | 1657.2 | 10.1 |
| Durable Goods | 960.2 | 5.9 | 973.2 | 5.9 |
| Nondurable Goods | 670.0 | 4.1 | 684.0 | 4.2 |
| Wholesale Trade | 908.5 | 5.6 | 934.4 | 5.7 |
| Retail Trade | 1132.0 | 7.0 | 1147.3 | 7.0 |
| Transportation & WH | 503.8 | 3.1 | 527.0 | 3.2 |
| Information | 612.0 | 3.8 | 623.4 | 3.8 |
| Finance, Insurance, RE | 2906.0 | 17.8 | 2878.8 | 17.5 |
| Professional & Business Services | 2333.0 | 14.3 | 2369.4 | 14.4 |
| Education, Health Care | 1652.0 | 10.1 | 1673.2 | 10.2 |
| Arts, Entertainment | 714.8 | 4.4 | 724.3 | 4.4 |
| Other Services | 478.1 | 2.9 | 482.9 | 2.9 |
| Government | 1909.6 | 11.7 | 1920.7 | 11.7 |
| Rest of the World | 214.3 | 1.3 | 202.4 | 1.2 |
Notes: SSAR: Seasonally-Adjusted Annual Rate; WCCA: Without Capital Consumption Adjustment by Industry; WH: Warehousing; RE, includes rental and leasing: Real Estate; Art, Entertainment includes recreation, accommodation and food services; BS: business services
Source: US Bureau of Economic Analysis
http://www.bea.gov/iTable/index_nipa.cfm
Motor vehicle sales and production in the US have been in long-term structural change. Table VA-1A provides the data on new motor vehicle sales and domestic car production in the US from 1990 to 2010. New motor vehicle sales grew from 14,137 thousand in 1990 to the peak of 17,806 thousand in 2000 or 29.5 percent. In that same period, domestic car production fell from 6,231 thousand in 1990 to 5,542 thousand in 2000 or -11.1 percent. New motor vehicle sales fell from 17,445 thousand in 2005 to 11,772 in 2010 or 32.5 percent while domestic car production fell from 4,321 thousand in 2005 to 2,840 thousand in 2010 or 34.3 percent. In Oct 2017, light vehicle sales accumulated to 14,229,448 million, which is lower by 1.7 percent relative to 14,479,407 a year earlier (http://www.motorintelligence.com/m_frameset.html). The seasonally adjusted annual rate of light vehicle sales in the US reached 18.09 million in Oct 2017, lower than 18.57 million in Sep 2017 and higher than 17.87 million in Oct 2016. (http://www.motorintelligence.com/m_frameset.html).
Table VA-1A, US, New Motor Vehicle Sales and Car Production, Thousand Units 7
| New Motor Vehicle Sales | New Car Sales and Leases | New Truck Sales and Leases | Domestic Car Production | |
| 1990 | 14,137 | 9,300 | 4,837 | 6,231 |
| 1991 | 12,725 | 8,589 | 4,136 | 5,454 |
| 1992 | 13,093 | 8,215 | 4,878 | 5,979 |
| 1993 | 14,172 | 8,518 | 5,654 | 5,979 |
| 1994 | 15,397 | 8,990 | 6,407 | 6,614 |
| 1995 | 15,106 | 8,536 | 6,470 | 6,340 |
| 1996 | 15,449 | 8,527 | 6,922 | 6,081 |
| 1997 | 15,490 | 8,273 | 7,218 | 5,934 |
| 1998 | 15,958 | 8,142 | 7,816 | 5,554 |
| 1999 | 17,401 | 8,697 | 8,704 | 5,638 |
| 2000 | 17,806 | 8,852 | 8,954 | 5,542 |
| 2001 | 17,468 | 8,422 | 9,046 | 4,878 |
| 2002 | 17,144 | 8,109 | 9,036 | 5,019 |
| 2003 | 16,968 | 7,611 | 9,357 | 4,510 |
| 2004 | 17,298 | 7,545 | 9,753 | 4,230 |
| 2005 | 17,445 | 7,720 | 9,725 | 4,321 |
| 2006 | 17,049 | 7,821 | 9,228 | 4,367 |
| 2007 | 16,460 | 7,618 | 8,683 | 3,924 |
| 2008 | 13,494 | 6,814 | 6.680 | 3,777 |
| 2009 | 10,601 | 5,456 | 5,154 | 2,247 |
| 2010 | 11,772 | 5,729 | 6,044 | 2,840 |
Source: US Census Bureau
http://www.census.gov/compendia/statab/cats/wholesale_retail_trade/motor_vehicle_sales.html
Chart I-5 of the Board of Governors of the Federal Reserve provides output of motor vehicles and parts in the United States from 1972 to 2017. Output virtually stagnated since the late 1990s with recent increase.
Chart 1-5, US, Motor Vehicles and Parts Output, 1972-2017
Source: Board of Governors of the Federal Reserve System
https://www.federalreserve.gov/releases/g17/Current/default.htm
Chart I-6 of the Board of Governors of the Federal Reserve System provides output of computers and electronic products in the United States from 1972 to 2017. Output accelerated sharply in the 1990s and 2000s and surpassed the level before the global recession beginning in IVQ2007.
Chart I-6, US, Output of Computers and Electronic Products, 1972-2017
Source: Board of Governors of the Federal Reserve System
https://www.federalreserve.gov/releases/g17/Current/default.htm
Chart I-7 of the Board of Governors of the Federal Reserve System shows that output of durable manufacturing accelerated in the 1980s and 1990s with slower growth in the 2000s perhaps because processes matured. Growth was robust after the major drop during the global recession but appears to vacillate in the final segment.
Chart I-7, US, Output of Durable Manufacturing, 1972-2017
Source: Board of Governors of the Federal Reserve System
https://www.federalreserve.gov/releases/g17/Current/default.htm
Chart I-8 of the Board of Governors of the Federal Reserve System provides output of aerospace and miscellaneous transportation equipment from 1972 to 2017. There is long-term upward trend with oscillations around the trend and cycles of large amplitude.
Chart I-8, US, Output of Aerospace and Miscellaneous Transportation Equipment, 1972-2017
Source: Board of Governors of the Federal Reserve System
https://www.federalreserve.gov/releases/g17/Current/default.htm
The Empire State Manufacturing Survey Index in Table VA-1 provides continuing deterioration that started in Jun 2012 well before Hurricane Sandy in Oct 2012. The current general index has been in negative contraction territory from minus 2.2 in Aug 2012 to minus 7.6 in Jan 2013 and minus 2.1 in May 2013. The current general index changed to 19.4 in Nov 2017. The index of current orders has also been in negative contraction territory from minus 2.9 in Aug 2012 to minus 9.8 in Jan 2013 and minus 7.9 in Jun 2013. The index of current new orders changed to 20.7 in Nov 2017. There is improvement in the general index for the next six months at 49.9 in Nov 2017 and new orders at 53.7.
Table VA-1, US, New York Federal Reserve Bank Empire State Manufacturing Survey Index SA
| Current General Index | Current New Orders | Future General Index | Future New Orders | |
| 9/30/2011 | -4 | -3.6 | 22.1 | 23.5 |
| 10/31/2011 | -5.1 | 2.8 | 14.3 | 19.7 |
| 11/30/2011 | 4.9 | 1.2 | 35.5 | 31.2 |
| 12/31/2011 | 11.5 | 9.4 | 46.2 | 43.6 |
| 1/31/2012 | 11.4 | 9.2 | 51.3 | 44.6 |
| 2/29/2012 | 17.4 | 7 | 46.7 | 38.7 |
| 3/31/2012 | 15.4 | 4.2 | 43.9 | 37.8 |
| 4/30/2012 | 7.6 | 4.5 | 40.2 | 37.4 |
| 5/31/2012 | 13.6 | 7.7 | 31.9 | 31.1 |
| 6/30/2012 | 1.5 | 1.5 | 27.5 | 28.4 |
| 7/31/2012 | 2.5 | -4 | 23.7 | 20.9 |
| 8/31/2012 | -2.2 | -2.9 | 19.3 | 14.1 |
| 9/30/2012 | -6.4 | -9.4 | 26.3 | 28 |
| 10/31/2012 | -3.5 | -5.5 | 20 | 22.6 |
| 11/30/2012 | -0.8 | 5.6 | 18.4 | 16.9 |
| 12/31/2012 | -6 | -1 | 19.8 | 19.3 |
| 1/31/2013 | -7.6 | -9.8 | 22 | 23.8 |
| 2/28/2013 | 8.9 | 12.6 | 32.9 | 28.6 |
| 3/31/2013 | 5.3 | 4.9 | 35 | 33 |
| 4/30/2013 | 4.2 | 1.6 | 30 | 34.3 |
| 5/31/2013 | -2.1 | -2.4 | 25.7 | 29.2 |
| 6/30/2013 | 4.8 | -7.9 | 27.6 | 22.5 |
| 7/31/2013 | 4.3 | 2.1 | 33 | 32.1 |
| 8/31/2013 | 10.7 | 2.5 | 36.5 | 30.3 |
| 9/30/2013 | 8.3 | 4.1 | 39.5 | 38.2 |
| 10/31/2013 | 5.3 | 10.1 | 41.2 | 37.1 |
| 11/30/2013 | 2.2 | -2.8 | 38.5 | 41.4 |
| 12/31/2013 | 2.5 | -0.8 | 37.6 | 27.9 |
| 1/31/2014 | 12.3 | 9 | 36.4 | 37.6 |
| 2/28/2014 | 6.1 | 2.4 | 41.1 | 45.6 |
| 3/31/2014 | 3.6 | 2.1 | 35.1 | 36.4 |
| 4/30/2014 | 3.5 | -2.5 | 37.8 | 32.9 |
| 5/31/2014 | 16.3 | 8.5 | 42.6 | 37.1 |
| 6/30/2014 | 16.4 | 13.6 | 41.2 | 44.5 |
| 7/31/2014 | 19.5 | 16.7 | 29.4 | 26.1 |
| 8/31/2014 | 17.6 | 15.2 | 46.5 | 50 |
| 9/30/2014 | 30.2 | 19.2 | 45.6 | 45.9 |
| 10/31/2014 | 8.4 | 2 | 42 | 42.4 |
| 11/30/2014 | 12 | 10 | 48.1 | 49.6 |
| 12/31/2014 | -3.4 | -1 | 36.9 | 35.9 |
| 1/31/2015 | 11.8 | 6.6 | 47.3 | 40.9 |
| 2/28/2015 | 9.6 | 3.5 | 29 | 31.8 |
| 3/31/2015 | 4.5 | -3.9 | 30.8 | 26.1 |
| 4/30/2015 | -0.8 | -7.5 | 36.1 | 31.9 |
| 5/31/2015 | 2.3 | 2.1 | 29.8 | 33.3 |
| 6/30/2015 | -4.1 | -5.4 | 26 | 27.2 |
| 7/31/2015 | 0.1 | -4.9 | 27.9 | 31.8 |
| 8/31/2015 | -12 | -14.7 | 34 | 30.4 |
| 9/30/2015 | -12.2 | -10.2 | 22.1 | 24 |
| 10/31/2015 | -10.4 | -15 | 22.3 | 23 |
| 11/30/2015 | -9.6 | -11.2 | 23.6 | 23.7 |
| 12/31/2015 | -7.3 | -6.7 | 35.2 | 24.8 |
| 1/31/2016 | -16.8 | -22.4 | 10.4 | 14 |
| 2/29/2016 | -14.5 | -9.7 | 17.1 | 24.1 |
| 3/31/2016 | -1.5 | 6.4 | 25.3 | 36.8 |
| 4/30/2016 | 8.4 | 7.9 | 28.9 | 34.8 |
| 5/31/2016 | -9 | -4.7 | 27.7 | 21.9 |
| 6/30/2016 | 3.7 | 8.2 | 33.3 | 37.6 |
| 7/31/2016 | -0.5 | -1.7 | 29.5 | 29.5 |
| 8/31/2016 | -3.2 | 1 | 26.9 | 28.4 |
| 9/30/2016 | -1.2 | -5 | 33 | 32.5 |
| 10/31/2016 | -5.5 | -3.1 | 35.3 | 38 |
| 11/30/2016 | 2.2 | 4 | 31.1 | 31.3 |
| 12/31/2016 | 7.6 | 10.4 | 49.7 | 46.3 |
| 1/31/2017 | 6.5 | 3.1 | 49.7 | 39.8 |
| 2/28/2017 | 18.7 | 13.5 | 41.7 | 43.8 |
| 3/31/2017 | 16.4 | 21.3 | 37.4 | 33.9 |
| 4/30/2017 | 5.2 | 7 | 39.9 | 31 |
| 5/31/2017 | -1 | -4.4 | 39.3 | 33.2 |
| 6/30/2017 | 19.8 | 18.1 | 41.7 | 42.2 |
| 7/31/2017 | 9.8 | 13.3 | 34.9 | 33.4 |
| 8/31/2017 | 25.2 | 20.6 | 45.2 | 41.3 |
| 9/30/2017 | 24.4 | 24.9 | 39.3 | 43.7 |
| 10/31/2017 | 30.2 | 18 | 44.8 | 44.8 |
| 11/30/2017 | 19.4 | 20.7 | 49.9 | 53.7 |
Source: Federal Reserve Bank of New York
http://www.ny.frb.org/survey/empire/empiresurvey_overview.htm
Chart VA-1 of the Federal Reserve Bank of New York provides indexes of current and expected economic activity. There were multiple contractions in current activity after the global recession shown in shade. Current activity is weakening relative to strong recovery in the initial expansion in 2010 and 2011 with recent recovery.
Chart VA-1, US, US, Federal Reserve Bank of New York, Diffusion Index of Current and Expected Activity, Seasonally Adjusted
Source: Federal Reserve Bank of New York
http://www.ny.frb.org/survey/empire/empiresurvey_overview.html
Table VA-2 shows improvement after prior deterioration followed by current soft improvement of the Business Outlook survey of the Federal Reserve Bank of Philadelphia. The general index moved out of contraction of 4.8 in Feb 2013 to expansion at 22.7 in Nov 2017. New orders moved from 0.1 in Feb 2013 to 21.4 in Nov 2017. There is improvement in the future general index at 56.4 in Nov 2017 and in future new orders at 47.8 in Nov 2017.
Table VA-2, US, Federal Reserve Bank of Philadelphia Business Outlook Survey, SA
| Current General Index | Current New Orders | Future General Index | Future New Orders | |
| Jan-11 | 16.5 | 20.7 | 36.2 | 38.1 |
| Feb-11 | 29 | 21 | 38.8 | 43.9 |
| Mar-11 | 36.5 | 34.7 | 55.6 | 54.8 |
| Apr-11 | 12.9 | 14.4 | 30.8 | 36.5 |
| May-11 | 6.2 | 8.5 | 25.1 | 28.7 |
| Jun-11 | -0.3 | -4.5 | 8.4 | 8.4 |
| Jul-11 | 7.2 | 2.8 | 32.2 | 27.6 |
| Aug-11 | -19.4 | -17.9 | 26.6 | 23.4 |
| Sep-11 | -11.5 | -6.5 | 19.6 | 21.8 |
| Oct-11 | 6.2 | 5.1 | 28.6 | 29.6 |
| Nov-11 | 4 | 0.3 | 36.3 | 33.8 |
| Dec-11 | 2.4 | 4.7 | 38.7 | 31.7 |
| Jan-12 | 7.4 | 11.1 | 44 | 43.9 |
| Feb-12 | 10.7 | 12.1 | 32.4 | 28.4 |
| Mar-12 | 8.9 | 1.3 | 37.3 | 31.1 |
| Apr-12 | 5.6 | 1.6 | 42 | 35 |
| May-12 | -0.7 | 2.8 | 35.4 | 30.6 |
| Jun-12 | -12.4 | -16.7 | 33.6 | 36.7 |
| Jul-12 | -12.6 | -5.4 | 25.5 | 19.1 |
| Aug-12 | -2.3 | 0.5 | 25.3 | 17.6 |
| Sep-12 | -0.9 | 0.3 | 42.6 | 34.7 |
| Oct-12 | -1.2 | -4.9 | 20.6 | 20.6 |
| Nov-12 | -10.6 | -9.1 | 23.3 | 24.2 |
| Dec-12 | 2.4 | 2.9 | 29.2 | 27.4 |
| Jan-13 | -1.6 | -2 | 32.4 | 37.4 |
| Feb-13 | -4.8 | 0.1 | 39.4 | 34.1 |
| Mar-13 | 2.3 | 2.6 | 38.5 | 34.4 |
| Apr-13 | 0.6 | 1.8 | 34.1 | 34.3 |
| May-13 | 0.5 | -2.9 | 42.1 | 38.3 |
| Jun-13 | 12.9 | 12.9 | 38.7 | 39 |
| Jul-13 | 15.9 | 4.9 | 51.9 | 43.6 |
| Aug-13 | 8.4 | 8 | 38.3 | 39.4 |
| Sep-13 | 19.2 | 19.4 | 51.1 | 47.9 |
| Oct-13 | 12.9 | 22.4 | 60.6 | 51.3 |
| Nov-13 | 4.4 | 7 | 47.5 | 41.2 |
| Dec-13 | 3.2 | 11.9 | 44.9 | 39.5 |
| Jan-14 | 14.9 | 7.8 | 41.9 | 38.9 |
| Feb-14 | 3.3 | 4.2 | 40.6 | 43.2 |
| Mar-14 | 13.4 | 10.3 | 39.6 | 47.3 |
| Apr-14 | 17.5 | 18.3 | 38.6 | 41.2 |
| May-14 | 19.3 | 15.7 | 42 | 42.7 |
| Jun-14 | 14.3 | 11.6 | 52.7 | 46.4 |
| Jul-14 | 20.7 | 25.3 | 47.4 | 50.2 |
| Aug-14 | 23 | 14.8 | 50.3 | 58.4 |
| Sep-14 | 20.4 | 14.7 | 44.2 | 50.8 |
| Oct-14 | 17.7 | 15.5 | 48.2 | 49.3 |
| Nov-14 | 34.8 | 27.2 | 47 | 48.2 |
| Dec-14 | 20.3 | 13.9 | 44.9 | 44.3 |
| Jan-15 | 12.5 | 9.9 | 48.7 | 47.8 |
| Feb-15 | 12.5 | 8.9 | 48 | 44.9 |
| Mar-15 | 8.6 | 6.5 | 39.5 | 38.5 |
| Apr-15 | 10.4 | 5.3 | 34.1 | 39.5 |
| May-15 | 8.2 | 6.2 | 33.9 | 32.9 |
| Jun-15 | 8.1 | 11.7 | 43.1 | 54 |
| Jul-15 | 2.9 | -1.6 | 42.2 | 44.3 |
| Aug-15 | 5.4 | 5.6 | 37.9 | 28 |
| Sep-15 | -4.8 | 11.9 | 40.9 | 38.9 |
| Oct-15 | -4.9 | -8.6 | 35.5 | 33.8 |
| Nov-15 | -4.3 | -10.5 | 48.3 | 41.6 |
| Dec-15 | -11.3 | -9.9 | 32.1 | 32 |
| Jan-16 | -5.3 | -2.7 | 23.6 | 26.1 |
| Feb-16 | -3.8 | -3.9 | 22.6 | 22.8 |
| Mar-16 | 10.6 | 12.7 | 37.6 | 34.2 |
| Apr-16 | -1.2 | -0.4 | 44.2 | 40 |
| May-16 | -1.5 | -1.5 | 38.2 | 35.6 |
| Jun-16 | 4.1 | -1.1 | 31.3 | 33.8 |
| Jul-16 | -0.9 | 6.1 | 30.9 | 28.6 |
| Aug-16 | 4.3 | -3.4 | 41.3 | 45.4 |
| Sep-16 | 11.6 | 5.3 | 37.3 | 32.8 |
| Oct-16 | 11.1 | 17.3 | 39.6 | 39.8 |
| Nov-16 | 8.7 | 15.2 | 41.1 | 31.7 |
| Dec-16 | 19.7 | 14.9 | 48.8 | 46.7 |
| Jan-17 | 23.6 | 26 | 54.5 | 59.1 |
| Feb-17 | 43.3 | 38 | 51.5 | 51.7 |
| Mar-17 | 32.8 | 38.6 | 61 | 54.8 |
| Apr-17 | 22 | 27.4 | 55.9 | 44.7 |
| May-17 | 38.8 | 25.4 | 47.2 | 38.5 |
| Jun-17 | 27.6 | 25.9 | 31.9 | 38.7 |
| Jul-17 | 19.5 | 2.1 | 39.4 | 25.9 |
| Aug-17 | 18.9 | 20.4 | 49.1 | 44.1 |
| Sep-17 | 23.8 | 29.5 | 56.9 | 55.8 |
| Oct-17 | 27.9 | 19.6 | 43.7 | 45.3 |
| Nov-17 | 22.7 | 21.4 | 56.4 | 47.8 |
Source: Federal Reserve Bank of Philadelphia
https://www.philadelphiafed.org/
Chart VA-2 of the Federal Reserve Bank of Philadelphia is very useful, providing current and future general activity indexes from Jan 2006 to May 2016. The shaded areas are the recession cycle dates of the National Bureau of Economic Research (NBER) (http://www.nber.org/cycles.html). The Philadelphia Fed index dropped during the initial period of recession and then led the recovery, as industry overall. There was a second decline of the index into 2011 followed now by what appeared as renewed strength from late 2011 into Jan 2012. There is decline to negative territory of the current activity index in Nov 2012 and return to positive territory in Dec 2012 with decline of current conditions into contraction in Jan-Feb 2013 and rebound to mild expansion in Mar-Apr 2013. The index of current activity moved into expansion in Jun-Oct 2013 with weakness in Nov-Dec 2013, improving in Jan 2014. There is renewed deterioration in Feb 2014 with rebound in Apr-Sep 2014 and mild deterioration in Oct 2014 followed by improvement in Nov 2014. The index deteriorated in Jan-Feb 2015, stabilizing in Mar-May 2015 and improving in Jun 2015. The index deteriorated in Jul 2015, improved in Aug 2015 and deteriorated in Sep-Oct 2015. The index shows contraction in Nov 2015 to Feb 2016 with recovery in Mar 2016. There is deterioration in Apr-May 2016 with improvement in Jun 2016 and deterioration in Jul 2016. There is improvement in Aug-Sep 2016 with moderate weakening in Oct-Nov 2016. The indexes improved sharply in Dec 2016 and Jan-Feb 2017, softening in Mar-Apr 2017. The current index weakened in Jun 2017 with stability in the six-month forecast. The current index deteriorated in Jul 2017 with improvement in the six-month forecast. The current index deteriorated in Aug 2017 with improvement in the six-month forecast. The current index improved in Sep 2017 with improvement in the six-month forecast. The current index and the future index deteriorated in Oct 2017. There is deterioration in Nov 2017 of the current index and improvement of the future index.
Chart VA-2, Federal Reserve Bank of Philadelphia Business Outlook Survey, Current and Future Activity Indexes
Source: Federal Reserve Bank of Philadelphia
https://www.philadelphiafed.org/
The index of current new orders of the Business Outlook Survey of the Federal Reserve Bank of Philadelphia in Chart VA-2 illustrates the weakness of the cyclical expansion. The index weakened in 2006 and 2007 and then fell sharply into contraction during the global recession. There have been twelve readings into contraction from Jan 2012 to May 2013 and generally weak readings with some exceptions. The index of new orders moved into expansion in Jun-Oct 2013 with moderation in Nov-Dec 2013 and into Jan 2014. The index fell into contraction in Feb 2014, recovering in Mar-Apr 2014 but weaker reading in May 2014. There is marked improvement in Jun-Jul 2014 with slowing in Aug-Oct 2014 followed by acceleration in Nov 2014. New orders deteriorated in Jan-Apr 2015, improving in May-Jun 2015. New orders deteriorated in Jul-Aug 2015 and improved in Sep 2015. New orders deteriorated in Oct-2015 to Dec 2015, contracting at slower pace in Jan 2016. There is sharper contraction in Feb 2016 and an upward jump in Mar 2016 followed by deterioration in Apr-Jun 2016. New orders improved in Jul 2016, deteriorating in Aug 2016 and improving in Sep 2016. Improvement continued in Oct-Nov 2016 with mild deterioration in Dec 2016 followed by improvement in Jan-Feb 2017, softening in Mar-Jul 2017, recovering in Aug-Sep 2017. There is deterioration in Oct 2017 followed by improvement in Nov 2017.
Chart VA-3, Federal Reserve Bank of Philadelphia Business Outlook Survey, Current New Orders Diffusion Index SA
Source: Federal Reserve Bank of Philadelphia
https://www.philadelphiafed.org/
II Squeeze of Economic Activity by Carry Trades Induced by Zero Interest Rates. Long-term economic growth in Japan significantly improved by increasing competitiveness in world markets. Net trade of exports and imports is an important component of the GDP accounts of Japan. Table VB-3 provides quarterly data for net trade, exports and imports of Japan. Net trade had strong positive contributions to GDP growth in Japan in all quarters from IQ2007 to IIQ2009 with exception of IVQ2008, IIIQ2008 and IQ2009. The US recession is dated by the National Bureau of Economic Research (NBER) as beginning in IVQ2007 (Dec) and ending in IIQ2009 (Jun) (http://www.nber.org/cycles/cyclesmain.html). Net trade contributions helped to cushion the economy of Japan from the global recession. Net trade deducted from GDP growth in six of the nine quarters from IVQ2010 to IQ2012. The only strong contribution of net trade was 3.5 percent in IIIQ2011. Net trade added 1.3 percentage points to GDP growth in IQ2013 but subtracted 0.1 percentage points in IIQ2013, deducting 1.4 percentage points in IIIQ2013 and 2.1 percentage points in IVQ2013. Net trade deducted 0.8 percentage points from GDP growth in IQ2014. Net trade added 4.1 percentage points to GDP growth in IIQ2014 and deducted 0.3 percentage points in IIIQ2014. Net trade added 1.5 percentage points to GDP growth in IVQ2014. Net trade contributed 0.0 percentage points to GDP growth in IQ2015 and deducted 0.4-percentage points in IIQ2015. Net trade deducted 0.4 percentage points from GDP growth in IIIQ2015. Net trade contributed 0.0 percentage points to GDP growth in IVQ2015 and added 1.4 percentage points in IQ2016. Net trade contributed 0.4 percentage points to GDP growth in IIQ2016. Net trade added 1.4 percentage points to GDP growth in IIIQ2016 and contributed 1.3 percentage points in IVQ2016. Net trade contributed 0.5 percentage points to GDP growth in IQ2017 and deducted 1.0 percentage points in IIQ2017. Net trade contributed 2.0 percentage points to GDP growth in IIIq2017. Private consumption assumed the role of driver of Japan’s economic growth but should moderate as in most mature economies.
Table VB-3, Japan, Contributions to Changes in Real GDP, Seasonally Adjusted Annual Rates (SAAR), %
| Net Trade | Exports | Imports | |
| 2017 | |||
| I | 0.5 | 1.3 | -0.8 |
| II | -1.0 | -0.1 | -0.9 |
| III | 2.0 | 1.0 | 1.0 |
| 2016 | |||
| I | 1.4 | 0.0 | 1.5 |
| II | 0.4 | -0.5 | 0.9 |
| III | 1.4 | 1.5 | 0.0 |
| IV | 1.3 | 2.1 | -0.9 |
| 2015 | |||
| I | 0.0 | 0.8 | -0.8 |
| II | -0.4 | -2.6 | 2.1 |
| III | -0.4 | 1.7 | -2.1 |
| IV | 0.0 | -0.3 | 0.3 |
| 2014 | |||
| I | -0.8 | 3.7 | -4.6 |
| II | 4.1 | 0.8 | 3.2 |
| III | -0.3 | 1.0 | -1.3 |
| IV | 1.5 | 2.4 | -0.9 |
| 2013 | |||
| I | 1.3 | 1.6 | -0.3 |
| II | -0.1 | 2.0 | -2.1 |
| III | -1.4 | -0.1 | -1.3 |
| IV | -2.1 | -0.1 | -2.0 |
| 2012 | |||
| I | 0.6 | 1.7 | -1.1 |
| II | -1.9 | -0.6 | -1.4 |
| III | -2.0 | -2.2 | 0.2 |
| IV | -0.3 | -1.9 | 1.6 |
| 2011 | |||
| I | -1.4 | -0.6 | -0.8 |
| II | -4.2 | -4.6 | 0.3 |
| III | 3.5 | 5.4 | -1.9 |
| IV | -2.6 | -1.6 | -1.0 |
| 2010 | |||
| I | 1.9 | 3.3 | -1.4 |
| II | 0.3 | 2.8 | -2.5 |
| III | 0.6 | 1.7 | -1.1 |
| IV | 0.0 | 0.2 | -0.3 |
| 2009 | |||
| I | -4.8 | -16.2 | 11.4 |
| II | 7.5 | 4.7 | 2.8 |
| III | 2.1 | 5.2 | -3.2 |
| IV | 2.9 | 4.2 | -1.3 |
| 2008 | |||
| I | 0.8 | 1.8 | -1.0 |
| II | 0.5 | -1.4 | 1.9 |
| III | -0.1 | 0.1 | -0.2 |
| IV | -10.3 | -9.3 | -1.0 |
| 2007 | |||
| I | 1.0 | 1.6 | -0.5 |
| II | 0.8 | 1.6 | -0.8 |
| III | 2.2 | 1.7 | 0.5 |
| IV | 1.3 | 2.0 | -0.7 |
Source: Japan Economic and Social Research Institute, Cabinet Office
http://www.esri.cao.go.jp/index-e.html
http://www.esri.cao.go.jp/en/sna/sokuhou/sokuhou_top.html
There was milder increase in Japan’s export corporate goods price index during the global recession in 2008 but similar sharp decline during the bank balance sheets effect in late 2008, as shown in Chart IV-5 of the Bank of Japan. Japan exports industrial goods whose prices have been less dynamic than those of commodities and raw materials. As a result, the export CGPI on the yen basis in Chart IV-5 trends down with oscillations after a brief rise in the final part of the recession in 2009. The export corporate goods price index on the yen basis fell from 93.9 in Jun 2009 to 84.1 in Jan 2012 or minus 10.4 percent and increased to 97.2 in Oct 2017 for gain of 15.6 percent relative to Jan 2012 and increase of 3.5 percent relative to Jun 2009. The choice of Jun 2009 is designed to capture the reversal of risk aversion beginning in Sep 2008 with the announcement of toxic assets in banks that would be withdrawn with the Troubled Asset Relief Program (TARP) (Cochrane and Zingales 2009). Reversal of risk aversion in the form of flight to the USD and obligations of the US government opened the way to renewed carry trades from zero interest rates to exposures in risk financial assets such as commodities. Japan exports industrial products and imports commodities and raw materials. The recovery from the global recession began in the third quarter of 2009.
Chart IV-5, Japan, Export Corporate Goods Price Index, Monthly, Yen Basis, 2008-2017
Source: Bank of Japan
http://www.stat-search.boj.or.jp/index_en.html
Chart IV-5A provides the export corporate goods price index on the basis of the contract currency. The export corporate goods price index on the basis of the contract currency increased from 105.9 in Jun 2009 to 111.5 in Apr 2012 or 5.3 percent but dropped to 101.2 in Oct 2017 or minus 9.2 percent relative to Apr 2012 and fell 4.4 percent to 101.2 in Oct 2017 relative to Jun 2009.
Chart IV-5A, Japan, Export Corporate Goods Price Index, Monthly, Contract Currency Basis, 2008-2017
Source: Bank of Japan
http://www.stat-search.boj.or.jp/index_en.html
Japan imports primary commodities and raw materials. As a result, the import corporate goods price index on the yen basis in Chart IV-6 shows an upward trend after declining from the increase during the global recession in 2008 driven by carry trades from fed funds rates. The index increases with carry trades from zero interest rates into commodity futures and declines during risk aversion from late 2008 into beginning of 2008 originating in doubts about soundness of US bank balance sheets. Measurement that is more careful should show that the terms of trade of Japan, export prices relative to import prices, declined during the commodity shocks originating in unconventional monetary policy. The decline of the terms of trade restricted potential growth of income in Japan (for the relation of terms of trade and growth see Pelaez 1979, 1976a). The import corporate goods price index on the yen basis increased from 82.4 in Jun 2009 to 99.6 in Apr 2012 or 20.9 percent and to 94.1 in Oct 2017 or decline of 5.5 percent relative to Apr 2012 and increase of 14.2 percent relative to Jun 2009.
Chart IV-6, Japan, Import Corporate Goods Price Index, Monthly, Yen Basis, 2008-2017
Source: Bank of Japan
http://www.stat-search.boj.or.jp/index_en.html
Chart IV-6A provides the import corporate goods price index on the contract currency basis. The import corporate goods price index on the basis of the contract currency increased from 95.0 in Jun 2009 to 131.6 in Apr 2012 or 38.5 percent and to 99.0 in Oct 2017 or minus 24.8 percent relative to Apr 2012 and increase of 4.2 percent relative to Jun 2009. There is evident deterioration of the terms of trade of Japan: the export corporate goods price index on the basis of the contract currency decreased 4.4 percent from Jun 2009 to Oct 2017 while the import corporate goods price index increased 4.2 percent. Prices of Japan’s exports of corporate goods, mostly industrial products, increased only 5.3 percent from Jun 2009 to Apr 2012, while imports of corporate goods, mostly commodities and raw materials increased 38.5 percent. Unconventional monetary policy induces carry trades from zero interest rates to exposures in commodities that squeeze economic activity of industrial countries by increases in prices of imported commodities and raw materials during periods without risk aversion. Reversals of carry trades during periods of risk aversion decrease prices of exported commodities and raw materials that squeeze economic activity in economies exporting commodities and raw materials. Devaluation of the dollar by unconventional monetary policy could increase US competitiveness in world markets but economic activity is squeezed by increases in prices of imported commodities and raw materials. Unconventional monetary policy causes instability worldwide instead of the mission of central banks of promoting financial and economic stability.
Chart IV-6A, Japan, Import Corporate Goods Price Index, Monthly, Contract Currency Basis, 2008-2017
Source: Bank of Japan
http://www.stat-search.boj.or.jp/index_en.html
Table IV-6B provides the Bank of Japan’s Corporate Goods Price indexes of exports and imports on the yen and contract bases from Jan 2008 to Oct 2017. There are oscillations of the indexes that are shown vividly in the four charts above. For the entire period from Jan 2008 to Oct 2017, the export index on the contract currency basis decreased 5.7 percent and decreased 5.9 percent on the yen basis. For the entire period from Jan 2008 to Oct 2017, the import price index decreased 10.7 percent on the contract currency basis and decreased 10.2 percent on the yen basis. During significant part of the expansion period, prices of Japan’s exports of corporate goods on the contract currency, mostly industrial products, increased only 5.3 percent from Jun 2009 to Apr 2012, while prices of imports of corporate goods on the contract currency, mostly commodities and raw materials, increased 38.5 percent. The charts show sharp deteriorations in relative prices of exports to prices of imports during multiple periods. Price margins of Japan’s producers are subject to periodic squeezes resulting from carry trades from zero interest rates of monetary policy to exposures in commodities.
Table IV-6B, Japan, Exports and Imports Corporate Goods Price Index, Contract Currency Basis and Yen Basis
| X-CC | X-Y | M-CC | M-Y | |
| 2008/01 | 107.3 | 103.3 | 110.9 | 104.8 |
| 2008/02 | 107.9 | 103.9 | 112.8 | 106.2 |
| 2008/03 | 108.7 | 100.7 | 115.1 | 103.4 |
| 2008/04 | 109.9 | 103.2 | 121.3 | 110.3 |
| 2008/05 | 110.7 | 105 | 124.9 | 114.9 |
| 2008/06 | 111.9 | 108 | 131.6 | 123.6 |
| 2008/07 | 113.2 | 109.2 | 135 | 126.8 |
| 2008/08 | 112.1 | 109.2 | 135.6 | 129.5 |
| 2008/09 | 111 | 105.8 | 129 | 120.8 |
| 2008/10 | 108.3 | 98.1 | 120.2 | 107 |
| 2008/11 | 106.6 | 93.5 | 107.7 | 93.2 |
| 2008/12 | 105.9 | 90 | 98.4 | 81.9 |
| 2009/01 | 106 | 89 | 94.3 | 77.9 |
| 2009/02 | 105.4 | 89.6 | 94.4 | 79 |
| 2009/03 | 105.2 | 93.2 | 93.8 | 81.9 |
| 2009/04 | 105.5 | 94.5 | 93 | 81.9 |
| 2009/05 | 105.4 | 92.9 | 92.5 | 80 |
| 105.9 | 93.9 | 95 | 82.4 | |
| 2009/07 | 105.4 | 92.2 | 98.3 | 83.7 |
| 2009/08 | 106.3 | 93.4 | 98.7 | 84.4 |
| 2009/09 | 106.3 | 91.4 | 100.2 | 83.4 |
| 2009/10 | 106 | 90.5 | 100.2 | 82.8 |
| 2009/11 | 106.4 | 90.2 | 102.2 | 83.5 |
| 2009/12 | 106.3 | 90.1 | 105.1 | 85.9 |
| 2010/01 | 107.5 | 91.4 | 106.8 | 88.1 |
| 2010/02 | 107.8 | 90.9 | 107.5 | 87.9 |
| 2010/03 | 107.8 | 91.1 | 106.8 | 87.4 |
| 2010/04 | 108.7 | 93.6 | 110 | 92.1 |
| 2010/05 | 108.9 | 92.1 | 112 | 92.4 |
| 2010/06 | 108.2 | 90.9 | 110.2 | 90.1 |
| 2010/07 | 107.5 | 88.6 | 110 | 87.9 |
| 2010/08 | 107.2 | 87.1 | 109.6 | 85.9 |
| 2010/09 | 107.5 | 86.8 | 110.2 | 85.6 |
| 2010/10 | 108.2 | 86.3 | 110.7 | 84.4 |
| 2010/11 | 108.9 | 87.1 | 113 | 86.5 |
| 2010/12 | 109.4 | 88 | 115 | 88.6 |
| 2011/01 | 110.4 | 88.2 | 118.1 | 90.4 |
| 2011/02 | 111.3 | 89 | 120.1 | 91.9 |
| 2011/03 | 111.9 | 89.1 | 123.2 | 93.6 |
| 2011/04 | 112.6 | 91 | 127.7 | 98.6 |
| 2011/05 | 112.3 | 89.4 | 130.9 | 99 |
| 2011/06 | 112.2 | 88.8 | 129.4 | 97.3 |
| 2011/07 | 112 | 88 | 130.3 | 97.1 |
| 2011/08 | 112 | 86.4 | 130.6 | 95.2 |
| 2011/09 | 112.1 | 86 | 128.9 | 93.6 |
| 2011/10 | 111.4 | 85.2 | 128.4 | 93 |
| 2011/11 | 110.2 | 84.8 | 127.1 | 92.8 |
| 2011/12 | 109.7 | 84.6 | 127.9 | 93.6 |
| 110.1 | 84.1 | 126.7 | 91.8 | |
| 2012/02 | 110.7 | 85.7 | 127.6 | 93.7 |
| 2012/03 | 111.3 | 88.8 | 130.3 | 99.5 |
| 111.5 | 88.3 | 131.6 | 99.6 | |
| 2012/05 | 110.6 | 86.2 | 130.1 | 96.7 |
| 2012/06 | 109.6 | 85 | 126.9 | 94 |
| 2012/07 | 108.8 | 84.1 | 123.4 | 91.2 |
| 2012/08 | 109.1 | 84.2 | 123.8 | 91.3 |
| 2012/09 | 109.2 | 84.2 | 126.3 | 92.7 |
| 2012/10 | 109.3 | 84.7 | 125.4 | 92.7 |
| 2012/11 | 109.1 | 85.8 | 124.7 | 93.8 |
| 2012/12 | 108.9 | 87.7 | 124.9 | 96.5 |
| 2013/01 | 109.2 | 91.6 | 125.4 | 101.7 |
| 2013/02 | 109.7 | 94.8 | 126.5 | 105.9 |
| 2013/03 | 109.5 | 95.4 | 126.8 | 107.5 |
| 2013/04 | 108.3 | 96.2 | 125.7 | 109.1 |
| 2013/05 | 107.7 | 97.6 | 124 | 110.4 |
| 2013/06 | 107.3 | 94.9 | 123.4 | 106.8 |
| 2013/07 | 107.2 | 96.2 | 122.9 | 108.2 |
| 2013/08 | 107 | 94.9 | 123.2 | 106.9 |
| 2013/09 | 107 | 95.9 | 124.5 | 109.2 |
| 2013/10 | 107.3 | 95.5 | 124.6 | 108.3 |
| 2013/11 | 107.2 | 96.6 | 124.6 | 110 |
| 2013/12 | 107.2 | 98.8 | 125.4 | 113.6 |
| 2014/01 | 107.3 | 99 | 126 | 114.6 |
| 2014/02 | 106.9 | 97.7 | 125.4 | 112.5 |
| 2014/03 | 106.6 | 97.6 | 124.9 | 112.2 |
| 2014/04 | 106.3 | 97.5 | 124.1 | 111.8 |
| 2014/05 | 106.2 | 96.8 | 123.8 | 110.9 |
| 2014/06 | 105.9 | 96.7 | 123.9 | 111.2 |
| 2014/07 | 106 | 96.5 | 123.9 | 110.9 |
| 2014/08 | 106.1 | 97.3 | 123.7 | 111.6 |
| 2014/09 | 105.9 | 99.3 | 122.8 | 114 |
| 2014/10 | 105.2 | 99.1 | 120.7 | 112.7 |
| 2014/11 | 104.8 | 103.4 | 117.8 | 115.9 |
| 2014/12 | 103.8 | 104.1 | 113.8 | 114 |
| 2015/01 | 102.2 | 101.2 | 108.2 | 106.6 |
| 2015/02 | 101.2 | 100.1 | 102.1 | 100.7 |
| 2015/03 | 101.3 | 100.9 | 103.1 | 102.6 |
| 2015/04 | 101.1 | 100.2 | 102 | 101 |
| 2015/05 | 101.4 | 101.4 | 101.6 | 101.5 |
| 2015/06 | 101.3 | 102.9 | 102.5 | 104.3 |
| 2015/07 | 100.6 | 101.7 | 101.5 | 102.9 |
| 2015/08 | 99.8 | 100.9 | 99 | 100.4 |
| 2015/09 | 98.6 | 98.2 | 96.6 | 96.2 |
| 2015/10 | 97.9 | 97.3 | 95.5 | 95 |
| 2015/11 | 97.5 | 98 | 94.9 | 95.7 |
| 2015/12 | 97.1 | 97.3 | 92.9 | 93.2 |
| 2016/01 | 96.4 | 94.7 | 89.9 | 88.3 |
| 2016/02 | 95.9 | 92.8 | 87.5 | 84.4 |
| 2016/03 | 96.1 | 92.1 | 87.3 | 83.2 |
| 2016/04 | 96.5 | 91 | 88.2 | 82.4 |
| 2016/05 | 96.6 | 90.6 | 88.6 | 82.4 |
| 2016/06 | 96.5 | 88.8 | 89.9 | 81.6 |
| 2016/07 | 96.9 | 88.2 | 90.8 | 81.5 |
| 2016/08 | 96.9 | 87.1 | 90.7 | 79.9 |
| 2016/09 | 97 | 87.4 | 91.2 | 80.7 |
| 2016/10 | 97.5 | 88.6 | 91.1 | 81.6 |
| 2016/11 | 98.1 | 91.2 | 93.8 | 86.3 |
| 2016/12 | 98.7 | 95.5 | 93.7 | 90.6 |
| 2017/01 | 99.4 | 95.6 | 96 | 92.1 |
| 2017/02 | 99.8 | 95.3 | 97.5 | 92.5 |
| 2017/03 | 100.3 | 95.7 | 98.3 | 93.2 |
| 2017/04 | 99.9 | 93.8 | 98.2 | 91.3 |
| 2017/05 | 99.5 | 94.7 | 98 | 92.6 |
| 2017/06 | 99.3 | 94 | 97.1 | 91 |
| 2017/07 | 99.4 | 95.1 | 96.1 | 91.1 |
| 2017/08 | 100 | 94.6 | 96.5 | 90 |
| 2017/09 | 100.6 | 95.6 | 97.8 | 91.7 |
| 101.2 | 97.2 | 99 | 94.1 |
Note: X-CC: Exports Contract Currency; X-Y: Exports Yen; M-CC: Imports Contract; M-Y: Imports Yen
Source: Bank of Japan
http://www.boj.or.jp/en/statistics/index.htm/
Japan also experienced sharp increase in inflation during the 1970s as in the episode of the Great Inflation in the US. Monetary policy focused on accommodating higher inflation, with emphasis solely on the mandate of promoting employment, has been blamed as deliberate or because of model error or imperfect measurement for creating the Great Inflation (http://cmpassocregulationblog.blogspot.com/2011/05/slowing-growth-global-inflation-great.html http://cmpassocregulationblog.blogspot.com/2011/04/new-economics-of-rose-garden-turned.html http://cmpassocregulationblog.blogspot.com/2011/03/is-there-second-act-of-us-great.html and Appendix I The Great Inflation; see Taylor 1993, 1997, 1998LB, 1999, 2012FP, 2012Mar27, 2012Mar28, 2012JMCB and http://cmpassocregulationblog.blogspot.com/2017/01/rules-versus-discretionary-authorities.html and earlier http://cmpassocregulationblog.blogspot.com/2012/06/rules-versus-discretionary-authorities.html). A remarkable similarity with US experience is the sharp rise of the CGPI of Japan in 2008 driven by carry trades from policy interest rates rapidly falling to zero to exposures in commodity futures during a global recession. Japan had the same sharp waves of consumer price inflation during the 1970s as in the US (see Chart IV-5A and associated table at 10/29/17 (https://cmpassocregulationblog.blogspot.com/2017/10/dollar-revaluation-and-increase-of.html https://cmpassocregulationblog.blogspot.com/2017/10/destruction-of-household-nonfinancial.html https://cmpassocregulationblog.blogspot.com/2017/08/dollar-devaluation-and-interest-rate.html https://cmpassocregulationblog.blogspot.com/2017/07/data-dependent-monetary-policy-with_30.html https://cmpassocregulationblog.blogspot.com/2017/07/dollar-devaluation-and-rising-yields.html https://cmpassocregulationblog.blogspot.com/2017/05/mediocre-cyclical-united-states.html https://cmpassocregulationblog.blogspot.com/2017/04/dollar-devaluation-mediocre-cyclical.html https://cmpassocregulationblog.blogspot.com/2017/04/mediocre-cyclical-economic-growth-with.html https://cmpassocregulationblog.blogspot.com/2017/03/rising-valuations-of-risk-financial.html http://cmpassocregulationblog.blogspot.com/2017/01/rising-valuations-of-risk-financial.html http://cmpassocregulationblog.blogspot.com/2017/01/rules-versus-discretionary-authorities.html http://cmpassocregulationblog.blogspot.com/2016/11/dollar-revaluation-rising-yields-and.html http://cmpassocregulationblog.blogspot.com/2016/10/mediocre-cyclical-united-states_30.html http://cmpassocregulationblog.blogspot.com/2016/10/mediocre-cyclical-united-states.html http://cmpassocregulationblog.blogspot.com/2016/08/and-as-ever-economic-outlook-is.html http://cmpassocregulationblog.blogspot.com/2016/07/business-fixed-investment-has-been-soft.html http://cmpassocregulationblog.blogspot.com/2016/07/financial-asset-values-rebound-from.html http://cmpassocregulationblog.blogspot.com/2016/05/appropriate-for-fed-to-increase.html http://cmpassocregulationblog.blogspot.com/2016/03/contraction-of-united-states-corporate.html http://cmpassocregulationblog.blogspot.com/2016/02/mediocre-cyclical-united-states.html http://cmpassocregulationblog.blogspot.com/2016/01/closely-monitoring-global-economic-and.html http://cmpassocregulationblog.blogspot.com/2015/12/dollar-revaluation-and-decreasing.html http://cmpassocregulationblog.blogspot.com/2015/11/dollar-revaluation-constraining.html http://cmpassocregulationblog.blogspot.com/2015/11/interest-rate-increase-considered.html http://cmpassocregulationblog.blogspot.com/2015/11/interest-rate-increase-considered.htmlhttp://cmpassocregulationblog.blogspot.com/2015/09/monetary-policy-designed-on-measurable.html
http://cmpassocregulationblog.blogspot.com/2015/08/fluctuations-of-global-financial.html http://cmpassocregulationblog.blogspot.com/2015/08/turbulence-of-valuations-of-financial_77.html http://cmpassocregulationblog.blogspot.com/2015/06/international-valuations-of-financial_29.html http://cmpassocregulationblog.blogspot.com/2015/06/dollar-revaluation-squeezing-corporate_97.html http://cmpassocregulationblog.blogspot.com/2015/05/dollar-devaluation-and-carry-trade.html http://cmpassocregulationblog.blogspot.com/2015/03/dollar-revaluation-and-financial-risk.html http://cmpassocregulationblog.blogspot.com/2015/03/irrational-exuberance-mediocre-cyclical.html http://cmpassocregulationblog.blogspot.com/2015/02/financial-and-international.html http://cmpassocregulationblog.blogspot.com/2014/12/valuations-of-risk-financial-assets.html http://cmpassocregulationblog.blogspot.com/2014/09/financial-volatility-mediocre-cyclical.html http://cmpassocregulationblog.blogspot.com/2014/09/geopolitical-and-financial-risks_71.html http://cmpassocregulationblog.blogspot.com/2014/03/financial-uncertainty-mediocre-cyclical_8145.html http://cmpassocregulationblog.blogspot.com/2014/03/financial-risks-slow-cyclical-united.html http://cmpassocregulationblog.blogspot.com/2014/02/mediocre-cyclical-united-states.html http://cmpassocregulationblog.blogspot.com/2013/12/collapse-of-united-states-dynamism-of.html http://cmpassocregulationblog.blogspot.com/2013/12/exit-risks-of-zero-interest-rates-world_1.html and earlier http://cmpassocregulationblog.blogspot.com/2013/10/twenty-eight-million-unemployed-or_561.html and at http://cmpassocregulationblog.blogspot.com/2013/09/increasing-interest-rate-risk_1.html http://cmpassocregulationblog.blogspot.com/2012/07/recovery-without-jobs-stagnating-real_09.html).
Chart IV-7, Japan, Domestic Corporate Goods Price Index, Monthly, 1960-2017
Source: Bank of Japan
http://www.stat-search.boj.or.jp/index_en.html
The producer price index of the US from 1970 to 2017 in Chart IV-8 shows various periods of more rapid or less rapid inflation but no bumps. The major event is the decline in 2008 when risk aversion because of the global recession caused the collapse of oil prices from $148/barrel to less than $80/barrel with most other commodity prices also collapsing. The event had nothing in common with explanations of deflation but rather with the concentration of risk exposures in commodities after the decline of stock market indexes. Eventually, there was a flight to government securities because of the fears of insolvency of banks caused by statements supporting proposals for withdrawal of toxic assets from bank balance sheets in the Troubled Asset Relief Program (TARP), as explained by Cochrane and Zingales (2009). The bump in 2008 with decline in 2009 is consistent with the view that zero interest rates with subdued risk aversion induce carry trades into commodity futures.
Chart IV-8, US, Producer Price Index Finished Goods, Monthly, 1960-2016
Source: US Bureau of Labor Statistics
Further insight into inflation of the corporate goods price index (CGPI) of Japan is in Table IV-7. The increase in the tax on value added of consumption caused sharp increases in prices across all segments. Petroleum and coal with weight of 6.0 percent increased 5.0 percent in Oct 2017 and increased 15.8 percent in 12 months. Japan exports manufactured products and imports raw materials and commodities such that the country’s terms of trade, or export prices relative to import prices, deteriorate during commodity price increases. In contrast, prices of production machinery, with weight of 4.1 percent, decreased 0.2 percent in Oct 2017 and decreased 0.3 percent in 12 months. In general, most manufactured products had been experiencing negative or low increases in prices while inflation rates have been high in 12 months for products originating in raw materials and commodities. The reversal of carry trades in commodity futures caused decrease in prices of commodities and raw materials while prices of manufactures stabilized. Ironically, unconventional monetary policy of zero interest rates and quantitative easing that intended to increase aggregate demand and GDP growth deteriorated the terms of trade of advanced economies with adverse effects on real income (for analysis of terms of trade and growth see Pelaez (1979, 1976a). There are now inflation effects of the intentional policy of devaluing the yen and recent collapse of commodity prices followed by increases.
Table IV-7, Japan, Corporate Goods Prices and Selected Components, % Weights, Month and 12 Months ∆%
| Oct 2017 | Weight | Month ∆% | 12 Month ∆% |
| Total | 1000.0 | 0.3 | 3.4 |
| Food, Beverages | 141.6 | 0.1 | 0.0 |
| Petroleum & Coal | 59.5 | 5.0 | 15.8 |
| Production Machinery | 41.1 | -0.2 | -0.3 |
| Electronic Components | 24.5 | 0.5 | 2.0 |
| Electric Power, Gas & Water | 67.1 | -3.7 | 11.2 |
| Iron & Steel | 51.7 | 0.0 | 9.7 |
| Chemicals | 89.2 | 0.8 | 3.6 |
| Transport | 140.7 | 0.1 | 0.1 |
Source: Bank of Japan
http://www.boj.or.jp/en/statistics/index.htm/
Percentage point contributions to change of the corporate goods price index (CGPI) in Oct 2017 are in Table IV-8, divided into domestic, export and import segments. In the domestic CGPI, increasing 0.3 percent in Oct 2017, the energy shock is evident in the contribution of 0.29 percentage points by petroleum and coal products in renewed carry trades of exposures in commodity futures. The exports CGPI increased 0.6 percent on the basis of the contract currency with contribution of 0.34 percentage points by chemicals and related products. The imports CGPI increased 1.2 percent on the contract currency basis. Petroleum, coal and natural gas contributed 0.89 percentage points. Shocks of risk aversion cause unwinding carry trades that result in declining commodity prices with resulting downward pressure on price indexes. The volatility of inflation adversely affects financial and economic decisions worldwide.
Table IV-8, Japan, Percentage Point Contributions to Change of Corporate Goods Price Index
| Groups Oct 2017 | Contribution to Change Percentage Points |
| A. Domestic Corporate Goods Price Index | Monthly Change: |
| Petroleum & Coal Products | 0.29 |
| Agriculture, Forestry & Fishery Products | 0.08 |
| Chemicals & Related Products | 0.07 |
| Nonferrous Metals | 0.06 |
| Metal Products | 0.02 |
| Electronic Components & Devices | 0.01 |
| Electric Power, Gas & Water | -0.24 |
| B. Export Price Index | Monthly Change: |
| Chemicals & Related Products | 0.34 |
| Metals & Related Products | 0.13 |
| Other Primary Products & Manufactured Goods | 0.06 |
| Electric & Electronic Products | 0.05 |
| C. Import Price Index | Monthly Change: 1.2% contract currency basis |
| Petroleum, Coal & Natural Gas | 0.89 |
| Chemicals & Related Products | 0.15 |
| Metals and Related Products | 0.14 |
| Other Primary Products & Manufactured Goods | 0.05 |
| Beverages & Foods & Agriculture Products for Food | 0.05 |
| Electric & Electronic Products | 0.04 |
| Textiles | -0.05 |
Source: Bank of Japan
http://www.boj.or.jp/en/statistics/index.htm/
There are two categories of responses in the Empire State Manufacturing Survey of the Federal Reserve Bank of New York (https://www.newyorkfed.org/survey/empire/empiresurvey_overview.html): current conditions and expectations for the next six months. There are responses in the survey for two types of prices: prices received or inputs of production and prices paid or sales prices of products. Table IV-5 provides indexes for the two categories and within them for the two types of prices from Jan 2011 to Nov 2017. The index of current prices paid or costs of inputs moved from 16.1 in Dec 2012 to 24.6 in Nov 2017 while the index of current prices received or sales prices moved from 1.1 in Dec 2012 to 9.2 in Nov 2017. The farther the index is from the area of no change at zero, the faster the rate of change. Prices paid or costs of inputs at 24.6 in Nov 2017 are expanding at faster pace than prices received or of sales of products at 9.2. The index of future prices paid or expectations of costs of inputs in the next six months fell from 51.6 in Dec 2012 to 48.5 in Nov 2017 while the index of future prices received or expectation of sales prices in the next six months decreased from 25.8 in Dec 2012 to 23.8 in Nov 2017. Prices paid or of inputs at 48.5 in Nov 2017 are expected to increase at a faster pace in the next six months than prices received or prices of sales products at 23.8 in Nov 2017. Prices of sales of finished products are less dynamic than prices of costs of inputs during waves of increases. Prices of costs of costs of inputs fall less rapidly than prices of sales of finished products during waves of price decreases. As a result, margins of prices of sales less costs of inputs oscillate with typical deterioration against producers, forcing companies to manage tightly costs and labor inputs. Instability of sales/costs margins discourages investment and hiring.
Table IV-5, US, FRBNY Empire State Manufacturing Survey, Diffusion Indexes, Prices Paid and Prices Received, SA
| Current Prices Paid | Current Prices Received | Future Prices Paid | Future Prices Received | |
| 1/31/2011 | 35.8 | 15.8 | 60 | 42.1 |
| 2/28/2011 | 45.8 | 16.9 | 55.4 | 27.7 |
| 3/31/2011 | 53.2 | 20.8 | 71.4 | 36.4 |
| 4/30/2011 | 57.7 | 26.9 | 56.4 | 38.5 |
| 5/31/2011 | 69.9 | 28 | 68.8 | 35.5 |
| 6/30/2011 | 56.1 | 11.2 | 55.1 | 19.4 |
| 7/31/2011 | 43.3 | 5.6 | 51.1 | 30 |
| 8/31/2011 | 28.3 | 2.2 | 42.4 | 15.2 |
| 9/30/2011 | 32.6 | 8.7 | 53.3 | 22.8 |
| 10/31/2011 | 22.5 | 4.5 | 40.4 | 18 |
| 11/30/2011 | 18.3 | 6.1 | 36.6 | 25.6 |
| 12/31/2011 | 24.4 | 3.5 | 57 | 36 |
| 1/31/2012 | 26.4 | 23.1 | 53.8 | 30.8 |
| 2/29/2012 | 25.9 | 15.3 | 62.4 | 34.1 |
| 3/31/2012 | 50.6 | 13.6 | 66.7 | 32.1 |
| 4/30/2012 | 45.8 | 19.3 | 50.6 | 22.9 |
| 5/31/2012 | 37.3 | 12 | 57.8 | 22.9 |
| 6/30/2012 | 19.6 | 1 | 34 | 17.5 |
| 7/31/2012 | 7.4 | 3.7 | 35.8 | 16 |
| 8/31/2012 | 16.5 | 2.4 | 31.8 | 14.1 |
| 9/30/2012 | 19.1 | 5.3 | 40.4 | 23.4 |
| 10/31/2012 | 17.2 | 4.3 | 44.1 | 24.7 |
| 11/30/2012 | 14.6 | 5.6 | 39.3 | 15.7 |
| 12/31/2012 | 16.1 | 1.1 | 51.6 | 25.8 |
| 1/31/2013 | 22.6 | 10.8 | 38.7 | 21.5 |
| 2/28/2013 | 26.3 | 8.1 | 44.4 | 13.1 |
| 3/31/2013 | 25.8 | 2.2 | 50.5 | 23.7 |
| 4/30/2013 | 28.4 | 5.7 | 44.3 | 14.8 |
| 5/31/2013 | 20.5 | 4.5 | 29.5 | 14.8 |
| 6/30/2013 | 21 | 11.3 | 45.2 | 17.7 |
| 7/31/2013 | 17.4 | 1.1 | 28.3 | 12 |
| 8/31/2013 | 20.5 | 3.6 | 41 | 19.3 |
| 9/30/2013 | 21.5 | 8.6 | 39.8 | 24.7 |
| 10/31/2013 | 21.7 | 2.4 | 45.8 | 25.3 |
| 11/30/2013 | 17.1 | -3.9 | 42.1 | 17.1 |
| 12/31/2013 | 15.7 | 3.6 | 48.2 | 27.7 |
| 1/31/2014 | 36.6 | 13.4 | 45.1 | 23.2 |
| 2/28/2014 | 25 | 15 | 40 | 23.8 |
| 3/31/2014 | 21.2 | 2.4 | 43.5 | 25.9 |
| 4/30/2014 | 22.4 | 10.2 | 33.7 | 14.3 |
| 5/31/2014 | 19.8 | 6.6 | 31.9 | 14.3 |
| 6/30/2014 | 17.2 | 4.3 | 36.6 | 16.1 |
| 7/31/2014 | 25 | 6.8 | 37.5 | 18.2 |
| 8/31/2014 | 27.3 | 8 | 42 | 21.6 |
| 9/30/2014 | 23.9 | 17.4 | 43.5 | 32.6 |
| 10/31/2014 | 11.4 | 6.8 | 42 | 26.1 |
| 11/30/2014 | 10.6 | 0 | 41.5 | 25.5 |
| 12/31/2014 | 10.4 | 6.3 | 40.6 | 32.3 |
| 1/31/2015 | 12.6 | 12.6 | 33.7 | 15.8 |
| 2/28/2015 | 14.6 | 3.4 | 27 | 5.6 |
| 3/31/2015 | 12.4 | 8.2 | 32 | 12.4 |
| 4/30/2015 | 19.1 | 4.3 | 38.3 | 13.8 |
| 5/31/2015 | 9.4 | 1 | 26 | 7.3 |
| 6/30/2015 | 9.6 | 1 | 24 | 5.8 |
| 7/31/2015 | 7.4 | 5.3 | 27.7 | 6.4 |
| 8/31/2015 | 7.3 | 0.9 | 34.5 | 10.9 |
| 9/30/2015 | 4.1 | -5.2 | 28.9 | 7.2 |
| 10/31/2015 | 0.9 | -8.5 | 27.4 | 7.5 |
| 11/30/2015 | 4.5 | -4.5 | 29.1 | 11.8 |
| 12/31/2015 | 4 | -4 | 27.3 | 20.2 |
| 1/31/2016 | 16 | 4 | 31 | 12 |
| 2/29/2016 | 3 | -5 | 14.9 | 4 |
| 3/31/2016 | 3 | -5.9 | 19.8 | 7.9 |
| 4/30/2016 | 19.2 | 2.9 | 27.9 | 5.8 |
| 5/31/2016 | 16.7 | -3.1 | 28.1 | 6.3 |
| 6/30/2016 | 18.4 | -1 | 29.6 | 7.1 |
| 7/31/2016 | 18.7 | 1.1 | 26.4 | 7.7 |
| 8/31/2016 | 15.5 | 2.1 | 25.8 | 9.3 |
| 9/30/2016 | 17 | 1.8 | 41.1 | 20.5 |
| 10/31/2016 | 22.6 | 4.7 | 35.8 | 30.2 |
| 11/30/2016 | 15.5 | 2.7 | 39.1 | 20.9 |
| 12/31/2016 | 22.6 | 3.5 | 42.6 | 22.6 |
| 1/31/2017 | 36.1 | 17.6 | 50.4 | 27.7 |
| 2/28/2017 | 37.8 | 19.4 | 38.8 | 25.5 |
| 3/31/2017 | 31 | 8.8 | 41.6 | 19.5 |
| 4/30/2017 | 32.8 | 12.4 | 37.2 | 25.5 |
| 5/31/2017 | 20.9 | 4.5 | 38.1 | 22.4 |
| 6/30/2017 | 20 | 10.8 | 33.1 | 13.8 |
| 7/31/2017 | 21.3 | 11 | 30.7 | 15.7 |
| 8/31/2017 | 31 | 6.2 | 33.3 | 21.7 |
| 9/30/2017 | 35.8 | 13.8 | 42.3 | 18.7 |
| 10/31/2017 | 27.3 | 7 | 41.4 | 25 |
| 11/30/2017 | 24.6 | 9.2 | 48.5 | 23.8 |
Source: Federal Reserve Bank of New York
https://www.newyorkfed.org/survey/empire/empiresurvey_overview.html
Price indexes of the Federal Reserve Bank of Philadelphia Outlook Survey are in Table IV-5A. As in inflation waves throughout the world (https://cmpassocregulationblog.blogspot.com/2017/11/dollar-devaluation-and-decline-of.html and earlier https://cmpassocregulationblog.blogspot.com/2017/10/world-inflation-waves-long-term-and.html) indexes of both current and expectations of future prices paid and received were quite high until May 2011. Prices paid, or inputs, were more dynamic, reflecting carry trades from zero interest rates to commodity futures. All indexes softened after May 2011 with even decline of prices received in Aug 2011 during the first round of risk aversion. Current and future price indexes have increased again but not back to the intensity in the beginning of 2011 because of risk aversion frustrating carry trades even induced by zero interest rates. The index of prices paid or prices of inputs moved from 20.6 in Dec 2012 to 39.0 in Nov 2017. The index of current prices received was minus 2.2 in Apr 2013, indicating decrease of prices received. The index of current prices received decreased from 9.1 in Dec 2012 to minus 5.7 in Sep 2015, decreasing to minus 4.8 in Feb 2016. The index of current prices received was 8.6 in Nov 2017. The farther the index is from the area of no change at zero, the faster the rate of change. The index of current prices paid or costs of inputs at 39.0 in Nov 2017 indicates faster expansion than the index of current prices received or sales prices of production in Nov 2017, showing 8.6. Prices paid indicate faster expansion than prices received during most of the history of the index. The index of future prices paid increased to 54.0 in Nov 2017 from 42.1 in Dec 2012 while the index of future prices received increased from 21.7 in Dec 2012 to 45.0 in Nov 2017. Expectations are incorporating faster increases in prices of inputs or costs of production, 54.0 in Nov 2017, than of sales prices of produced goods, 45.0 in Nov 2017, forcing companies to manage tightly costs and labor inputs. Volatility of margins of sales/costs discourages investment and hiring.
Table IV-5A, US, Federal Reserve Bank of Philadelphia Business Outlook Survey, Current and Future Prices Paid and Prices Received, SA
| Current Prices Paid | Current Prices Received | Future Prices Paid | Future Prices Received | |
| Dec-10 | 42.7 | 5.3 | 56.2 | 24.2 |
| Jan-11 | 48.2 | 12.6 | 59 | 34.6 |
| Feb-11 | 61.4 | 13.7 | 69.1 | 31.6 |
| Mar-11 | 59.2 | 17.9 | 61.5 | 33.5 |
| Apr-11 | 52.8 | 22.9 | 56.4 | 36.3 |
| May-11 | 51.2 | 20.6 | 54.8 | 28.4 |
| Jun-11 | 36 | 6.4 | 40.7 | 6.8 |
| Jul-11 | 34.1 | 5.6 | 47.8 | 17.3 |
| Aug-11 | 23.6 | -3.4 | 42.6 | 22.8 |
| Sep-11 | 30.1 | 6.4 | 38.1 | 20.4 |
| Oct-11 | 22.7 | 1.6 | 41.3 | 27.8 |
| Nov-11 | 21.8 | 5.2 | 34.4 | 26.4 |
| Dec-11 | 24.9 | 5.6 | 42.7 | 21.1 |
| Jan-12 | 26.1 | 9.2 | 48.1 | 21.9 |
| Feb-12 | 33.3 | 10.4 | 52.5 | 26.4 |
| Mar-12 | 17.6 | 6.9 | 38.7 | 24.8 |
| Apr-12 | 21.9 | 9.7 | 37 | 25.1 |
| May-12 | 10.2 | 1.1 | 39.9 | 9 |
| Jun-12 | 1.2 | -5.9 | 32.7 | 16.8 |
| Jul-12 | 8.1 | 3.3 | 26.8 | 20.6 |
| Aug-12 | 16.3 | 6.6 | 34.7 | 23.9 |
| Sep-12 | 12.9 | 2.7 | 38.1 | 24.6 |
| Oct-12 | 17.3 | 4.6 | 44.1 | 15.2 |
| Nov-12 | 22.2 | 4.7 | 45.8 | 10.7 |
| Dec-12 | 20.6 | 9.1 | 42.1 | 21.7 |
| Jan-13 | 13 | 0.8 | 35.4 | 21.8 |
| Feb-13 | 12.7 | 0.2 | 36.9 | 23.1 |
| Mar-13 | 13.8 | 1.3 | 35.2 | 20.5 |
| Apr-13 | 11.7 | -2.2 | 31.2 | 16.7 |
| May-13 | 12.6 | 0.5 | 34.5 | 19 |
| Jun-13 | 17.2 | 11.8 | 29.4 | 23.9 |
| Jul-13 | 18.9 | 5.6 | 39.6 | 25 |
| Aug-13 | 17.9 | 12.6 | 33.6 | 23.4 |
| Sep-13 | 22.1 | 11.5 | 37.1 | 26.8 |
| Oct-13 | 17.4 | 8.9 | 41.4 | 34.5 |
| Nov-13 | 23.3 | 6.5 | 41 | 36.3 |
| Dec-13 | 16.5 | 8.8 | 40.6 | 28.2 |
| Jan-14 | 20.4 | 8.6 | 38.2 | 13.8 |
| Feb-14 | 16.1 | 9.7 | 31.1 | 19.6 |
| Mar-14 | 22.6 | 7.5 | 33.9 | 20.7 |
| Apr-14 | 21.3 | 10.8 | 38.2 | 21.1 |
| May-14 | 26.7 | 17.2 | 37.7 | 28.9 |
| Jun-14 | 26.6 | 10.5 | 41.9 | 29.4 |
| Jul-14 | 29.8 | 13.9 | 35.9 | 21.8 |
| Aug-14 | 21.5 | 5.8 | 44 | 28.6 |
| Sep-14 | 21.7 | 7.5 | 38.7 | 25.3 |
| Oct-14 | 23.6 | 16.9 | 31 | 21.7 |
| Nov-14 | 14.2 | 8 | 32.7 | 18.4 |
| Dec-14 | 14.4 | 11.1 | 26.1 | 20.1 |
| Jan-15 | 12.3 | 3 | 31.6 | 21.1 |
| Feb-15 | 6 | 2.3 | 37.4 | 22.3 |
| Mar-15 | 3.4 | -4.6 | 30.8 | 10.2 |
| Apr-15 | 1.7 | -2 | 19.6 | 13.6 |
| May-15 | -14.1 | -7.1 | 22.3 | 19 |
| Jun-15 | 10.4 | 1.4 | 38 | 11.5 |
| Jul-15 | 16.6 | 0.3 | 32.9 | 15.9 |
| Aug-15 | 2.8 | -3.7 | 33.5 | 9.9 |
| Sep-15 | -2.8 | -5.7 | 24.7 | 4.1 |
| Oct-15 | -1.7 | -1.2 | 17.7 | 8.7 |
| Nov-15 | -7 | -3.4 | 23.6 | 10.5 |
| Dec-15 | -9.5 | -6.8 | 25.5 | 13.8 |
| Jan-16 | -1.2 | -2.2 | 20.4 | 11.5 |
| Feb-16 | -2.8 | -4.8 | 16.4 | 4.1 |
| Mar-16 | 1.5 | 2.9 | 25.1 | 15.3 |
| Apr-16 | 13.7 | 6.1 | 35.3 | 21.4 |
| May-16 | 13.5 | 11.5 | 23.9 | 12.5 |
| Jun-16 | 21.2 | 4.1 | 34.4 | 17.1 |
| Jul-16 | 11.9 | 1.3 | 27.4 | 22.3 |
| Aug-16 | 18.7 | 6.6 | 29.7 | 15.5 |
| Sep-16 | 20.8 | 9.4 | 39.8 | 31.2 |
| Oct-16 | 8.9 | -1.9 | 41.5 | 27.9 |
| Nov-16 | 27.6 | 16.4 | 38.3 | 30.6 |
| Dec-16 | 28.1 | 8 | 46.5 | 29.1 |
| Jan-17 | 32.5 | 26.8 | 49 | 27.5 |
| Feb-17 | 29.9 | 10.6 | 51.1 | 23.5 |
| Mar-17 | 40.7 | 20.6 | 55.7 | 40.2 |
| Apr-17 | 33.7 | 16.6 | 34.7 | 28.6 |
| May-17 | 24.2 | 15.3 | 42.7 | 22.9 |
| Jun-17 | 23.6 | 20.6 | 40.9 | 28.7 |
| Jul-17 | 19.1 | 9 | 46.6 | 29.7 |
| Aug-17 | 21.1 | 13.5 | 34.8 | 40.4 |
| Sep-17 | 34.4 | 22.8 | 46.2 | 31.7 |
| Oct-17 | 38.1 | 14.2 | 60.2 | 41.1 |
| Nov-17 | 39 | 8.6 | 54 | 45 |
Source: Federal Reserve Bank of Philadelphia
https://www.philadelphiafed.org/
Chart IV-1 of the Business Outlook Survey of the Federal Reserve Bank of Philadelphia Outlook Survey provides the diffusion index of current prices paid or prices of inputs from 2006 to 2017. Recession dates are in shaded areas. In the middle of deep global contraction after IVQ2007, input prices continued to increase in speculative carry trades from central bank policy rates falling toward zero into commodities futures. The index peaked above 70 in the second half of 2008. Inflation of inputs moderated significantly during the shock of risk aversion in late 2008, even falling briefly into contraction territory below zero during several months in 2009 in the flight away from risk financial assets into US government securities (Cochrane and Zingales 2009) that unwound carry trades. Return of risk appetite induced carry trade with significant increase until return of risk aversion in the first round of the European sovereign debt crisis in Apr 2010. Carry trades returned during risk appetite in expectation that the European sovereign debt crisis was resolved. The various inflation waves originating in carry trades induced by zero interest rates with alternating episodes of risk aversion are mirrored in the prices of inputs after 2011, in particular after Aug 2012 with the announcement of the Outright Monetary Transactions Program of the European Central Bank (http://www.ecb.int/press/pr/date/2012/html/pr120906_1.en.html). Subsequent risk aversion and flows of capital away from commodities into stocks and high-yield bonds caused sharp decline in the index of prices paid followed by another recent rebound with marginal decline and new increase. The index falls, rebounds and falls again in the final segment but there are no episodes of contraction after 2009 with exception of minus 14.1 in May 2015, minus 2.8 in Sep 2015, minus 1.7 in Oct 2015, minus 7.0 in Nov 2015 and minus 9.5 in Dec 2015. The reading for the index in Jan 2016 is minus 1.2 and minus 2.8 for Feb 2016. The index is 1.5 in Mar 2016 and 13.7 in Apr 2016, increasing at 13.5 in May 2016 and 21.2 in Jun 2016. The index reached 11.9 in Jul 2016, 18.7 in Aug 2016 and 20.8 in Sep 2016. The index was 8.9 in Oct 2016 and 39.0 in Nov 2017.
Chart IV-1, Federal Reserve Bank of Philadelphia Business Outlook Survey Current Prices Paid Diffusion Index SA
Source: Federal Reserve Bank of Philadelphia
https://www.philadelphiafed.org/
Chart IV-2 of the Federal Reserve Bank of Philadelphia Outlook Survey provides the diffusion index of current prices received from 2006 to 2017. The significant difference between the index of current prices paid in Chart IV-1 and the index of current prices received in Chart IV-2 is that increases in prices paid are significantly sharper than increases in prices received. There were several periods of negative readings of prices received from 2010 to 2016. Prices paid increased at 3.4 in Mar 2015 while prices received contracted at 4.6. There were several contractions of prices paid: 14.1 in May 2015 with milder contraction of 7.1 of prices received; minus 2.8 for prices paid in Sep 2015 with minus 5.7 for prices received; and minus 1.7 for prices paid in Oct 2015 with minus 1.2 for prices received. The index of prices received fell to minus 7.0 in Nov 2015 with minus 3.4 for prices paid and to minus 9.5 in Dec 2015 with minus 6.8 for prices paid. The index of prices received fell to minus 4.8 in Feb 2016 with minus 2.8 for prices paid. The index of prices paid increased at 1.5 in Mar 2016 with 2.9 for prices received. Prices paid moved to 39.0 in Nov 2017 while prices received moved to 8.6. Prices received relative to prices paid deteriorate most of the time largely because of the carry trades from zero interest rates to commodity futures. Profit margins of business are compressed intermittently by fluctuations of commodity prices induced by unconventional monetary policy of zero interest rates, frustrating production, investment and hiring decisions of business, which is precisely the opposite outcome pursued by unconventional monetary policy.
Chart IV-2, Federal Reserve Bank of Philadelphia Business Outlook Survey Current Prices Received Diffusion Index SA
Source: Federal Reserve Bank of Philadelphia
https://www.philadelphiafed.org/
Chart IV-2A of the Federal Reserve Bank of Philadelphia shows current prices paid and current prices received from Jan 2007 to Mar 2017. Current prices paid jumped ahead of current prices received during the contraction from IVQ2007 to IIQ2009 through the carry trade from zero interest rates to exposures in commodity derivatives. There is the same behavior during most of the cyclical expansion after IIIQ2009. Rebalancing of financial investment portfolios away from commodities into equities explains the recent weakness of prices paid. There is a new ongoing carry trade into commodity futures.
Chart IV-2A, Federal Reserve Bank of Philadelphia Business Outlook Survey Current Prices Paid and Current Prices Received Diffusion Index SA
Source: Federal Reserve Bank of Philadelphia
https://www.philadelphiafed.org/
Chart IV-2B of the Federal Reserve Bank of Philadelphia shows the six-month forecast and current prices received of the Business Outlook Survey from 2007 to Jun 2017. There is correlation in the direction of the indexes. The six-month forecast is typically above current prices received. There is upward trend in both indexes in the final segment with wide fluctuations.
Chart IV-2B, Federal Reserve Bank of Philadelphia Business Outlook Survey Current Prices Received and Future Prices Received Diffusion Index SA
Source: Federal Reserve Bank of Philadelphia
https://www.philadelphiafed.org/
Chart IV-2C of the Federal Reserve Bank of Philadelphia shows the six-month forecast and current prices received of the Business Outlook Survey from 2007 to Jul 2017. There is correlation in the direction of the indexes. The six-month forecast is typically above current prices received. There is upward trend in both indexes in the final segment with wide fluctuations.
Chart IV-2c, Federal Reserve Bank of Philadelphia Business Outlook Survey Current Prices Received and Future Prices Received Diffusion Index SA
Source: Federal Reserve Bank of Philadelphia
https://www.philadelphiafed.org/
Chart IV-2D of the Federal Reserve Bank of Philadelphia shows the six-month forecast and current prices received of the Business Outlook Survey from 2007 to Sep 2017. There is correlation in the direction of the indexes. The six-month forecast is typically above current prices received. There is upward trend in both indexes in the final segment with wide fluctuations.
Chart IV-2d, Federal Reserve Bank of Philadelphia Business Outlook Survey Current Prices Received and Future Prices Received Diffusion Index SA
Source: Federal Reserve Bank of Philadelphia
https://www.philadelphiafed.org/
Chart IV-2DE of the Federal Reserve Bank of Philadelphia shows the six-month forecast and current prices received of the Business Outlook Survey from 2007 to Oct 2017. There is correlation in the direction of the indexes. The six-month forecast is typically above current prices received. There is upward trend in both indexes in the final segment with wide fluctuations.
Chart IV-2de, Federal Reserve Bank of Philadelphia Business Outlook Survey Current Prices Received and Future Prices Received Diffusion Index SA
Source: Federal Reserve Bank of Philadelphia
https://www.philadelphiafed.org/
© Carlos M. Pelaez, 2009, 2010, 2011, 2012, 2013, 2014, 2015, 2016, 2017.
No comments:
Post a Comment