
US Consumer Price Index Increased 8.5 Percent in 12 Months Ending in Mar 2022, which is the Highest Increase since 8.9 Percent in Dec 1981, Producer Prices of Finished Goods Increased 15.2 Percent in 12 Months Ending in Mar 2022 and Final Demand Producer Prices Increased 11.2 Percent, United States International Trade, United States Current Account and Net International Investment Position, United States Inflation, Stagflation Risks, Worldwide Fiscal, Monetary and External Imbalances, World Cyclical Slow Growth, and Government Intervention in Globalization
Carlos M. Pelaez
© Carlos M. Pelaez, 2009, 2010, 2011, 2012, 2013, 2014, 2015, 2016, 2017, 2018, 2019, 2020, 2021, 2022.
IC United States Inflation
IC Long-term US Inflation
ID Current US Inflation
IIA United States International Trade
II United States Current Account of Balance of Payments and International Investment Position
III World Financial Turbulence
IV Global Inflation
V World Economic Slowdown
VA United States
VB Japan
VC China
VD Euro Area
VE Germany
VF France
VG Italy
VH United Kingdom
VI Valuation of Risk Financial Assets
VII Economic Indicators
VIII Interest Rates
IX Conclusion
References
Appendixes
Appendix I The Great Inflation
IIIB Appendix on Safe Haven Currencies
IIIC Appendix on Fiscal Compact
IIID Appendix on European Central Bank Large Scale Lender of Last Resort
IIIG Appendix on Deficit Financing of Growth and the Debt Crisis
Preamble. United States total public debt outstanding is $30.3 trillion and debt held by the public $23.8 trillion (https://fiscaldata.treasury.gov/datasets/debt-to-the-penny/debt-to-the-penny). The Net International Investment Position of the United States, or foreign debt, is $18.1 trillion (https://www.bea.gov/sites/default/files/2022-03/intinv421.pdf Section II and earlier https://cmpassocregulationblog.blogspot.com/2022/01/increase-in-dec-2021-of-nonfarm-payroll.html). The United States current account deficit is 3.6 percent of GDP in IVQ2021 (https://cmpassocregulationblog.blogspot.com/2022/03/accelerating-inflation-throughout-world.html https://www.bea.gov/sites/default/files/2022-03/trans421.pdf). The Treasury deficit of the United States reached $2.8 trillion in fiscal year 2021 (https://fiscal.treasury.gov/reports-statements/mts/). Total assets of Federal Reserve Banks reached $9.0 trillion on Apr 13, 2022 and securities held outright reached $8.5 trillion (https://www.federalreserve.gov/releases/h41/current/h41.htm#h41tab1). US GDP nominal NSA reached $24.0 trillion in IVQ2021 (https://apps.bea.gov/iTable/index_nipa.cfm). Total Treasury interest-bearing, marketable debt held by private investors increased from $3635 billion in 2007 to $16,439 billion in Sep 2021 (Fiscal Year 2021) or increase by 352.2 percent (https://fiscal.treasury.gov/reports-statements/treasury-bulletin/). John Hilsenrath, writing on “Economists Seek Recession Cues in the Yield Curve,” published in the Wall Street Journal on Apr 2, 2022, analyzes the inversion of the Treasury yield curve with the two-year yield at 2.430 on Apr 1, 2022, above the ten-year yield at 2.374. Hilsenrath argues that inversion appears to signal recession in market analysis but not in alternative Fed approach.
Chart CPI-H provides 12 months percentage changes of the US Consumer Price Index from 1981 to 2022. The increase of 8.5 percent of the US CPI in the 12 months ending in Mar 2022 is the highest since 8.9 percent in Dec 1981 in the beginning adjustment from the Great Inflation.
Chart CPI-H, US, Consumer Price Index, 12-Month Percentage Change, NSA, 1981-2022
Source: US Bureau of Labor Statistics https://www.bls.gov/cpi/data.htm
Chart VII-4 of the Energy Information Administration provides the price of the Natural Gas Futures Contract increasing from $2.581 on Jan 4, 2021 to $6.680 per million Btu on Apr 12, 2022 or 158.8 percent.
Chart VII-4, US, Natural Gas Futures Contract 1
Source: US Energy Information Administration
https://www.eia.gov/dnav/ng/hist/rngc1d.htm
Chart VII-5 of the US Energy Administration provides US field production of oil decreasing from a peak of 12,966 thousand barrels per day in Nov 2019 to the final point of 11.371 thousand barrels per day in Jan 2022.
Chart VII-5, US, US, Field Production of Crude Oil, Thousand Barrels Per Day
Source: US Energy Information Administration
https://www.eia.gov/dnav/pet/hist/LeafHandler.ashx?n=PET&s=MCRFPUS2&f=M
Chart VI-6 of the US Energy Information Administration provides imports of crude oil. Imports increased from 245,369 thousand barrels per day in Jan 2021 to 252,916 thousand in Jan 2022.
Chart VII-6, US, US, Imports of Crude Oil and Petroleum Products, Thousand Barrels
Source: US Energy Information Administration
https://www.eia.gov/dnav/pet/hist/LeafHandler.ashx?n=PET&s=MTTIMUS1&f=M
Chart VI-7 of the EIA provides US Petroleum Consumption, Production, Imports, Exports and Net Imports 1950-2020. There was sharp increase in production in the final segment that reached consumption in 2020.
Chart VI-7, US Petroleum Consumption, Production, Imports, Exports and Net Imports 1950-2020, Million Barrels Per Day
https://www.eia.gov/energyexplained/oil-and-petroleum-products/imports-and-exports.php
II United States International Trade. Table IIA-1 provides the trade balance of the US and monthly growth of exports and imports seasonally adjusted with the latest release and revisions (https://www.census.gov/economic-indicators/). Because of heavy dependence on imported oil, fluctuations in the US trade account originate largely in fluctuations of commodity futures prices caused by carry trades from zero interest rates into commodity futures exposures in a process similar to world inflation waves (https://cmpassocregulationblog.blogspot.com/2022/03/accelerating-inflation-throughout-world.html and earlier https://cmpassocregulationblog.blogspot.com/2022/02/us-gdp-growing-at-saar-of-70-percent-in.html). The Census Bureau revised data for 2022, 2021, 2020, 2019, 2018, 2017, 2016, 2015, 2014 and 2013. Exports increased 1.8 percent in Feb 2022 while imports increased 1.3 percent in the global recession, with output in the US reaching a high in Feb 2020 (https://www.nber.org/research/data/us-business-cycle-expansions-and-contractions), in the lockdown of economic activity in the COVID-19 event and the through in Apr 2020 (https://www.nber.org/news/business-cycle-dating-committee-announcement-july-19-2021). The trade deficit decreased from $89,229 million in Jan 2021 to $89,185 million in Feb 2022. The trade deficit deteriorated to $43,454 million in Feb 2016, improving to $36,916 million in Mar 2016. The trade deficit deteriorated to $38,127 million in Apr 2016, deteriorating to $39,149 million in May 2016 and $41,873 million in Jun 2016. The trade deficit improved to $40,148 million in Jul 2016, moving to $40,421 million in Aug 2016. The trade deficit improved to $37,237 million in Sep 2016, deteriorating to $38,766 million in Oct 2016. The trade deficit deteriorated to $44,082 million in Nov 2016, improving to $41,144 million in Jan 2016. The trade deficit deteriorated to $42,946 million in Jan 2017, improving to $39,811 million in Feb 2017. The trade deficit deteriorated to $41,476 million in Mar 2017 and $44,357 million in Apr 2017, improving to $44,127 million in May 2017. The trade deficit improved to $43,002 million in Jun 2017, deteriorating to $42,007 million in Jul 2017. The trade deficit improved to $41,163 million in Aug 2017, improving to $41,464 million in Sep 2017. The trade deficit deteriorated to $41,615 million in Oct 2017, deteriorating to $44,623 million in Nov 2017. The trade deficit deteriorated to 46,149 million in Jan 2017, deteriorating to $47,056 million in Jan 2018. The trade deficit deteriorated to $49,149 million in Feb 2018, improving to $43,981 million in Mar 2018. The trade deficit worsened to $45,105 million in Apr 2018, improving to $41,185 million in May 2018. The trade deficit deteriorated to $44,871 million in Jun 2018, deteriorating to $49,512 million in Jul 2018. The trade deficit improved to $49,738 million in Aug 2018 and deteriorated to $51,773 million in Sep 2018. The trade deficit deteriorated to $52,345 million in Oct 2018 and improved to $50,547 million in Nov 2018. The trade deficit deteriorated to $55,687 million in Jan 2018, improving to $48,818 million in Jan 2019. The trade deficit improved to $48,032 million in Feb 2019, deteriorating to $49,777 million in Mar 2019. The trade deficit deteriorated to $50,074 million in Apr 2019, deteriorating to $51,904 million in May 2019. The trade deficit improved to $50,390 million in Jun 2019, improving to $49,959 million in Jul 2019. The trade deficit deteriorated to $50,388 million in Aug 2019, improving to $48,262 million in Sep 2019. The trade deficit improved to $42,720 million in Oct 2019, improving to $40,596 million in Nov 2019. The trade deficit deteriorated to $45,421 million in Jan 2019, deteriorating to $45,452 million in Jan 2020. The trade deficit improved to $41,639 million in Feb 2020, deteriorating to $47,157 million in Mar 2020. The trade deficit deteriorated to $52,959 million in Apr 2020. The trade deficit deteriorated to $54,915 million in May 2020, improving to $50,675 million in Jun 2020. The trade deficit deteriorated to $60,743 million in Jul 2020, deteriorating to $63,733 million in Aug 2020. The trade deficit improved to $62,625 million in Sep 2020. The trade deficit deteriorated to $63,678 million in Oct 2020, deteriorating to $67,307 million in Nov 2020. The trade deficit improved to $65,802 million in Jan 2020. The trade deficit improved to 65,124 million in Jan 2021. The trade deficit deteriorated to $67,548 million in Feb 2021. The trade deficit deteriorated to $71,395 million in Mar 2021. The trade deficit improved to 65,428 million in Apr 2021. The trade deficit deteriorated to $67,297 million in May 2021. The trade deficit deteriorated to $72,228 million in Jun 2021. The trade deficit improved to $69,712 million in Jul 2021. The trade deficit deteriorated to $72,521 million in Aug 2021. The trade deficit deteriorated to $81.159 million in Sep 2021. The trade deficit improved to $66,945 million in Oct 2021. The trade deficit deteriorated to $80,068 million in Nov 2021. The trade deficit deteriorated to $81,957 million in Jan 2021. The trade deficit deteriorated to $89,229 million in Jan 2022. The trade deficit improved to $89,185 million in Feb 2022. Exports increased 1.8 percent in Feb 2022 while imports increased 1.3 percent.
Table IIA-1, US, Trade Balance of Goods and Services Seasonally Adjusted Millions of Dollars and ∆%
| Balance | Exports | ∆% | Imports | ∆% | ||
| Jan-2016 | -40,157 | 180,840 | -1.9 | 220,997 | -2.0 | |
| Feb-2016 | -43,454 | 182,895 | 1.1 | 226,349 | 2.4 | |
| Mar-2016 | -36,916 | 181,919 | -0.5 | 218,835 | -3.3 | |
| Apr-2016 | -38,127 | 184,034 | 1.2 | 222,161 | 1.5 | |
| May-2016 | -39,149 | 184,948 | 0.5 | 224,097 | 0.9 | |
| Jun-2016 | -41,873 | 186,622 | 0.9 | 228,495 | 2.0 | |
| Jul-2016 | -40,148 | 187,910 | 0.7 | 228,058 | -0.2 | |
| Aug-2016 | -40,421 | 189,850 | 1.0 | 230,271 | 1.0 | |
| Sep-2016 | -37,237 | 190,415 | 0.3 | 227,652 | -1.1 | |
| Oct-2016 | -38,766 | 189,089 | -0.7 | 227,854 | 0.1 | |
| Nov-2016 | -44,082 | 187,434 | -0.9 | 231,516 | 1.6 | |
| Dec-2016 | -41,144 | 192,381 | 2.6 | 233,525 | 0.9 | |
| Jan-2017 | -42,946 | 195,303 | 1.5 | 238,248 | 2.0 | |
| Feb-2017 | -39,811 | 195,839 | 0.3 | 235,650 | -1.1 | |
| Mar-2017 | -41,476 | 195,880 | 0.0 | 237,356 | 0.7 | |
| Apr-2017 | -44,357 | 195,851 | 0.0 | 240,208 | 1.2 | |
| May-2017 | -44,127 | 195,404 | -0.2 | 239,531 | -0.3 | |
| Jun-2017 | -43,002 | 197,631 | 1.1 | 240,633 | 0.5 | |
| Jul-2017 | -42,007 | 197,812 | 0.1 | 239,820 | -0.3 | |
| Aug-2017 | -41,163 | 198,638 | 0.4 | 239,800 | 0.0 | |
| Sep-2017 | -41,464 | 200,747 | 1.1 | 242,211 | 1.0 | |
| Oct-2017 | -41,615 | 202,584 | 0.9 | 244,199 | 0.8 | |
| Nov-2017 | -44,623 | 205,999 | 1.7 | 250,623 | 2.6 | |
| Dec-2017 | -46,149 | 209,091 | 1.5 | 255,241 | 1.8 | |
| Jan-2018 | -47,056 | 206,058 | -1.5 | 253,114 | -0.8 | |
| Feb-2018 | -49,149 | 208,776 | 1.3 | 257,925 | 1.9 | |
| Mar-2018 | -43,981 | 213,123 | 2.1 | 257,104 | -0.3 | |
| Apr-2018 | -45,105 | 213,183 | 0.0 | 258,289 | 0.5 | |
| May-2018 | -41,185 | 216,094 | 1.4 | 257,279 | -0.4 | |
| Jun-2018 | -44,871 | 213,698 | -1.1 | 258,569 | 0.5 | |
| Jul-2018 | -49,512 | 211,824 | -0.9 | 261,336 | 1.1 | |
| Aug-2018 | -49,738 | 211,054 | -0.4 | 260,791 | -0.2 | |
| Sep-2018 | -51,773 | 212,793 | 0.8 | 264,566 | 1.4 | |
| Oct-2018 | -52,345 | 213,861 | 0.5 | 266,206 | 0.6 | |
| Nov-2018 | -50,547 | 210,383 | -1.6 | 260,930 | -2.0 | |
| Dec-2018 | -55,687 | 207,793 | -1.2 | 263,480 | 1.0 | |
| Jan-2019 | -48,818 | 209,087 | 0.6 | 257,905 | -2.1 | |
| Feb-2019 | -48,032 | 210,133 | 0.5 | 258,165 | 0.1 | |
| Mar-2019 | -49,777 | 213,813 | 1.8 | 263,590 | 2.1 | |
| Apr-2019 | -50,074 | 210,289 | -1.6 | 260,363 | -1.2 | |
| May-2019 | -51,904 | 213,973 | 1.8 | 265,877 | 2.1 | |
| Jun-2019 | -50,390 | 210,575 | -1.6 | 260,965 | -1.8 | |
| Jul-2019 | -49,959 | 211,469 | 0.4 | 261,428 | 0.2 | |
| Aug-2019 | -50,388 | 210,474 | -0.5 | 260,862 | -0.2 | |
| Sep-2019 | -48,262 | 208,776 | -0.8 | 257,037 | -1.5 | |
| Oct-2019 | -42,720 | 210,157 | 0.7 | 252,877 | -1.6 | |
| Nov-2019 | -40,596 | 209,739 | -0.2 | 250,335 | -1.0 | |
| Dec-2019 | -45,421 | 209,883 | 0.1 | 255,304 | 2.0 | |
| Jan-2020 | -45,452 | 205,091 | -2.3 | 250,543 | -1.9 | |
| Feb-2020 | -41,639 | 204,819 | -0.1 | 246,458 | -1.6 | |
| Mar-2020 | -47,157 | 187,490 | -8.5 | 234,647 | -4.8 | |
| Apr-2020 | -52,959 | 150,074 | -20.0 | 203,033 | -13.5 | |
| May-2020 | -54,915 | 146,108 | -2.6 | 201,023 | -1.0 | |
| Jun-2020 | -50,675 | 158,805 | 8.7 | 209,480 | 4.2 | |
| Jul-2020 | -60,743 | 170,908 | 7.6 | 231,651 | 10.6 | |
| Aug-2020 | -63,733 | 174,287 | 2.0 | 238,020 | 2.7 | |
| Sep-2020 | -62,625 | 178,063 | 2.2 | 240,689 | 1.1 | |
| Oct-2020 | -63,678 | 182,732 | 2.6 | 246,410 | 2.4 | |
| Nov-2020 | -67,307 | 185,186 | 1.3 | 252,494 | 2.5 | |
| Dec-2020 | -65,802 | 190,877 | 3.1 | 256,678 | 1.7 | |
| Jan-2021 | -65,124 | 194,531 | 1.9 | 259,654 | 1.2 | |
| Feb-2021 | -67,548 | 190,631 | -2.0 | 258,179 | -0.6 | |
| Mar-2021 | -71,395 | 205,355 | 7.7 | 276,750 | 7.2 | |
| Apr-2021 | -65,428 | 207,737 | 1.2 | 273,166 | -1.3 | |
| May-2021 | -67,297 | 209,717 | 1.0 | 277,015 | 1.4 | |
| Jun-2021 | -72,228 | 210,933 | 0.6 | 283,161 | 2.2 | |
| Jul-2021 | -69,712 | 213,385 | 1.2 | 283,097 | 0.0 | |
| Aug-2021 | -72,521 | 214,498 | 0.5 | 287,019 | 1.4 | |
| Sep-2021 | -81,159 | 208,008 | -3.0 | 289,167 | 0.7 | |
| Oct-2021 | -66,945 | 224,752 | 8.0 | 291,697 | 0.9 | |
| Nov-2021 | -80,068 | 225,062 | 0.1 | 305,130 | 4.6 | |
| Dec-2021 | -81,957 | 228,347 | 1.5 | 310,304 | 1.7 | |
| Jan-2022 | -89,229 | 224,490 | -1.7 | 313,720 | 1.1 | |
| Feb-2022 | -89,185 | 228,630 | 1.8 | 317,814 | 1.3 |
Source: US Census Bureau
https://www.census.gov/economic-indicators/
Table IIA-1B provides US exports, imports and the trade balance of goods. The US has not shown a trade surplus in trade of goods since 1976. The deficit of trade in goods deteriorated sharply during the boom years from 2000 to 2007. The deficit improved during the contraction in 2009 but deteriorated in the expansion after 2009. The deficit could deteriorate sharply with growth at full employment.
Table IIA-1B, US, International Trade Balance of Goods, Exports and Imports of Goods, Millions of Dollars, Census Basis
| Balance | Exports | ∆% | Imports | ∆ | ||
| 1960 | 4,608 | 19,626 | 15,018 | |||
| 1961 | 5,476 | 18.8 | 20,190 | 2.9 | 14,714 | -2.0 |
| 1962 | 4,583 | -16.3 | 20,973 | 3.9 | 16,390 | 11.4 |
| 1963 | 5,289 | 15.4 | 22,427 | 6.9 | 17,138 | 4.6 |
| 1964 | 7,006 | 32.5 | 25,690 | 14.5 | 18,684 | 9.0 |
| 1965 | 5,333 | -23.9 | 26,699 | 3.9 | 21,366 | 14.4 |
| 1966 | 3,837 | -28.1 | 29,379 | 10.0 | 25,542 | 19.5 |
| 1967 | 4,122 | 7.4 | 30,934 | 5.3 | 26,812 | 5.0 |
| 1968 | 837 | -79.7 | 34,063 | 10.1 | 33,226 | 23.9 |
| 1969 | 1,289 | 54.0 | 37,332 | 9.6 | 36,043 | 8.5 |
| 1970 | 3,224 | 150.1 | 43,176 | 15.7 | 39,952 | 10.8 |
| 1971 | -1,476 | -145.8 | 44,087 | 2.1 | 45,563 | 14.0 |
| 1972 | -5,729 | 288.1 | 49,854 | 13.1 | 55,583 | 22.0 |
| 1973 | 2,389 | -141.7 | 71,865 | 44.2 | 69,476 | 25.0 |
| 1974 | -3,884 | -262.6 | 99,437 | 38.4 | 103,321 | 48.7 |
| 1975 | 9,551 | -345.9 | 108,856 | 9.5 | 99,305 | -3.9 |
| 1976 | -7,820 | -181.9 | 116,794 | 7.3 | 124,614 | 25.5 |
| 1977 | -28,352 | 262.6 | 123,182 | 5.5 | 151,534 | 21.6 |
| 1978 | -30,205 | 6.5 | 145,847 | 18.4 | 176,052 | 16.2 |
| 1979 | -23,922 | -20.8 | 186,363 | 27.8 | 210,285 | 19.4 |
| 1980 | -19,696 | -17.7 | 225,566 | 21.0 | 245,262 | 16.6 |
| 1981 | -22,267 | 13.1 | 238,715 | 5.8 | 260,982 | 6.4 |
| 1982 | -27,510 | 23.5 | 216,442 | -9.3 | 243,952 | -6.5 |
| 1983 | -52,409 | 90.5 | 205,639 | -5.0 | 258,048 | 5.8 |
| 1984 | -106,702 | 103.6 | 223,976 | 8.9 | 330,678 | 28.1 |
| 1985 | -117,711 | 10.3 | 218,815 | -2.3 | 336,526 | 1.8 |
| 1986 | -138,279 | 17.5 | 227,159 | 3.8 | 365,438 | 8.6 |
| 1987 | -152,119 | 10.0 | 254,122 | 11.9 | 406,241 | 11.2 |
| 1988 | -118,526 | -22.1 | 322,426 | 26.9 | 440,952 | 8.5 |
| 1989 | -109,399 | -7.7 | 363,812 | 12.8 | 473,211 | 7.3 |
| 1990 | -101,719 | -7.0 | 393,592 | 8.2 | 495,311 | 4.7 |
| 1991 | -66,723 | -34.4 | 421,730 | 7.1 | 488,453 | -1.4 |
| 1992 | -84,501 | 26.6 | 448,164 | 6.3 | 532,665 | 9.1 |
| 1993 | -115,568 | 36.8 | 465,091 | 3.8 | 580,659 | 9.0 |
| 1994 | -150,630 | 30.3 | 512,626 | 10.2 | 663,256 | 14.2 |
| 1995 | -158,801 | 5.4 | 584,742 | 14.1 | 743,543 | 12.1 |
| 1996 | -170,214 | 7.2 | 625,075 | 6.9 | 795,289 | 7.0 |
| 1997 | -180,522 | 6.1 | 689,182 | 10.3 | 869,704 | 9.4 |
| 1998 | -229,758 | 27.3 | 682,138 | -1.0 | 911,896 | 4.9 |
| 1999 | -328,821 | 43.1 | 695,797 | 2.0 | 1,024,618 | 12.4 |
| 2000 | -436,104 | 32.6 | 781,918 | 12.4 | 1,218,022 | 18.9 |
| 2001 | -411,899 | -5.6 | 729,100 | -6.8 | 1,140,999 | -6.3 |
| 2002 | -468,262 | 13.7 | 693,104 | -4.9 | 1,161,366 | 1.8 |
| 2003 | -532,350 | 13.7 | 724,771 | 4.6 | 1,257,121 | 8.2 |
| 2004 | -654,829 | 23.0 | 814,875 | 12.4 | 1,469,703 | 16.9 |
| 2005 | -772,374 | 18.0 | 901,082 | 10.6 | 1,673,456 | 13.9 |
| 2006 | -827,970 | 7.2 | 1,025,969 | 13.9 | 1,853,939 | 10.8 |
| 2007 | -808,765 | -2.3 | 1,148,197 | 11.9 | 1,956,962 | 5.6 |
| 2008 | -816,200 | 0.9 | 1,287,441 | 12.1 | 2,103,641 | 7.5 |
| 2009 | -503,583 | -38.3 | 1,056,042 | -18.0 | 1,559,625 | -25.9 |
| 2010 | -635,365 | 26.2 | 1,278,493 | 21.1 | 1,913,858 | 22.7 |
| 2011 | -725,447 | 14.2 | 1,482,507 | 16.0 | 2,207,954 | 15.4 |
| 2012 | -730,446 | 0.7 | 1,545,821 | 4.3 | 2,276,267 | 3.1 |
| 2013 | -689,470 | -5.6 | 1,578,517 | 2.1 | 2,267,987 | -0.4 |
| 2014 | -734,482 | 6.5 | 1,621,874 | 2.7 | 2,356,356 | 3.9 |
| 2015 | -745,483 | 1.5 | 1,503,328 | -7.3 | 2,248,811 | -4.6 |
| 2016 | -735,326 | -1.4 | 1,451,460 | -3.5 | 2,186,786 | -2.8 |
| 2017 | -792,396 | 7.8 | 1,547,195 | 6.6 | 2,339,591 | 7.0 |
| 2018 | -870,358 | 9.8 | 1,665,787 | 7.7 | 2,536,145 | 8.4 |
| 2019 | -850,917 | -2.2 | 1,642,820 | -1.4 | 2,493,738 | -1.7 |
| 2020 | -911,056 | 7.1 | 1,424,935 | -13.3 | 2,335,991 | -6.3 |
| 2021 | -1,078,566 | 18.4 | 1,754,504 | 23.1 | 2,833,070 | 21.3 |
Source: US Census Bureau
https://www.census.gov/economic-indicators/
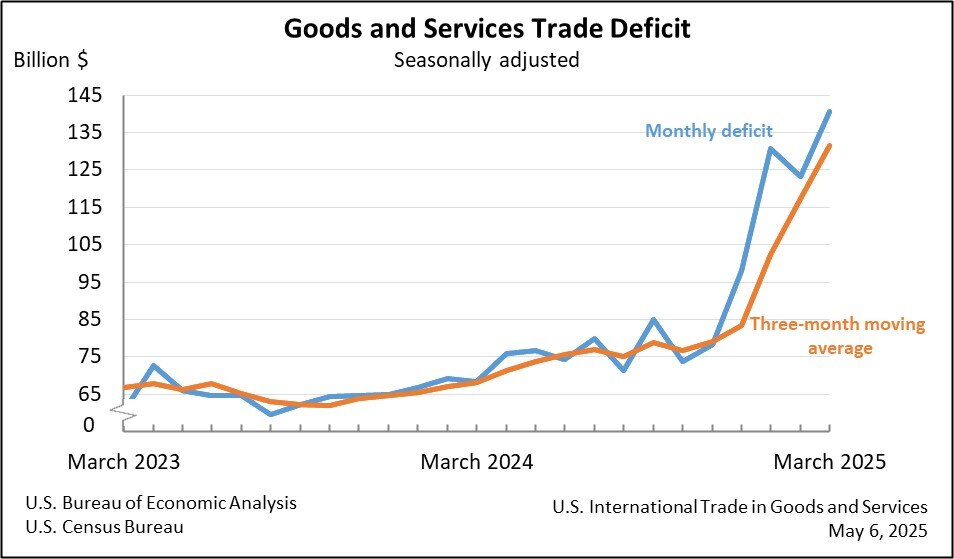
There is recent sharp deterioration of the US trade balance and the three-month moving average in Chart IIA-1 of the US Census Bureau with further improvement in Jan-Feb 2019. There is marginal improvement in Jun-Nov 2019 with deterioration in Jan 2019. There is improvement in Jan-Feb 2020 with deterioration in Mar-May 2020 followed by improvement in Jun 2020. There is deterioration in Jul-Aug 2020 and improvement in Sep 2020 followed by deterioration in Oct-Nov 2020. There is improvement in Jan 2020 followed by deterioration in Jan-Mar 2021 with improvement in Apr 2021. There is deterioration in May-Jun 2021, improvement in Jul 2021 and deterioration in Aug-Sep 2021. There is improvement in Oct 2021 followed by deterioration in Nov-Jan 2021. There is deterioration in Jan 2022 with improvement in Feb 2022.
Chart IIA-1A, US, International Trade Balance, Exports and Imports of Goods and Services and Three-Month Moving Average, USD Billions
Source: US Census Bureau
https://www.census.gov/economic-indicators/
Chart IIA-1A of the US Census Bureau of the Department of Commerce shows that the trade deficit (gap between exports and imports) fell during the economic contraction after 2007 but has grown again during the expansion. The low average rate of growth of GDP of 2.0 percent during the expansion beginning since IIIQ2009 does not deteriorate further the trade balance. Higher rates of growth may cause sharper deterioration.
Chart IIA-1, US, International Trade Balance, Exports and Imports of Goods and Services USD Billions
Source: US Census Bureau
https://www.census.gov/foreign-trade/data/ustrade.jpg
Table IIA-2B provides the US international trade balance, exports and imports of goods and services on an annual basis from 1960 to 2021. The trade balance deteriorated sharply over the long term. The US has a large deficit in goods or exports less imports of goods but it has a surplus in services that helps to reduce the trade account deficit or exports less imports of goods and services. The current account deficit as percent of GDP at 2.4 percent in IQ2019 increases to 1.9 percent in IVQ2019. The current account deficit at 2.1 percent in IQ2020 increases to 3.2 percent in IIQ2020. The current account deficit increases to 3.3 percent in IIIQ2020. The current account deficit stabilizes to 3.3 percent of GDP in IVQ2020. The current account deficit increases to 3.4 percent in IQ2021. The current account deficit increases to 3.5 percent of GDP in IIQ2021. The current account deficit increases to 3.7 percent in IIIQ2021. The absolute value of the net international investment position increases at $13.0 trillion in IIQ2020. The absolute value of the net international investment position increases to $13.8 trillion in IIIQ2020. The absolute value of the net international position increases to $14.0 trillion in IVQ2020. The absolute value of the net international investment position increased to $14.3 trillion in IQ2021. The absolute value of the net international investment position increases to $15.9 trillion in IIQ2021. The absolute value of the net international investment position increases to $16.1 trillion in IIIQ2021. The ratio of the current account deficit to GDP has stabilized close 3 percent of GDP compared with much higher percentages before the recession but is combined now with much higher imbalance in the Treasury budget (see Pelaez and Pelaez, The Global Recession Risk (2007), Globalization and the State, Vol. II (2008b), 183-94, Government Intervention in Globalization (2008c), 167-71). There is still a major challenge in the combined deficits in current account and in federal budgets. The final rows of Table IIA-2B show marginal improvement of the trade deficit from $554,522 million in 2011 to lower $525,906 million in 2012 with exports growing 4.8 percent and imports 2.8 percent. The trade balance improved further to deficit of $446,861 million in 2013 with growth of exports of 2.9 percent while imports virtually stagnated, decreasing 0.5 percent. The trade deficit deteriorated in 2014 to $483,952 million with growth of exports of 3.4 percent and of imports of 4.2 percent. The trade deficit deteriorated in 2015 to $491,421 million with increase of exports of 4.7 percent and increase of imports of 3.7 percent. The trade deficit improved in 2016 to $481,475 million with rease of exports of 1.8 percent and Janrease of imports of 1.9 percent. The trade deficit deteriorated in 2017 to $512,739 million with growth of exports of 6.8 percent and of imports of 6.8 percent. The trade deficit deteriorated in 2018 to $580,950 million with growth of exports of 6.2 percent and of imports of 7.4 percent. The trade deficit improved in 2019 to $576,341 million with Janrease of exports of 0.4 percent and Janrease of imports of 0.5 percent. The trade deficit deteriorated to $676,684 million in 2020 with Janrease of exports of 15.6 percent and Janrease of imports of 9.5 percent in the global recession, with output in the US reaching a high in Feb 2020 (https://www.nber.org/research/data/us-business-cycle-expansions-and-contractions), in the lockdown of economic activity in the COVID-19 event and the through in Apr 2020 (https://www.nber.org/news/business-cycle-dating-committee-announcement-july-19-2021). The trade deficit deteriorated to $861,383 million in 2021with growth of exports of 18.7 percent and increase of imports of 20.7 percent. Growth and commodity shocks under alternating inflation waves (https://cmpassocregulationblog.blogspot.com/2022/02/us-gdp-growing-at-saar-of-70-percent-in.html and earlier https://cmpassocregulationblog.blogspot.com/2022/01/fomc-states-with-inflation-well-above-2.html) have deteriorated the trade deficit from the low of $394,771 million in 2009.
Table IIA-2B, US, International Trade Balance of Goods and Services, Exports and Imports of Goods and Services, SA, Millions of Dollars, Balance of Payments Basis
| Balance | Exports | Imports | ||||
| Period | Total | Total | ∆% | Total | ∆% | |
| 1960 | 3,508 | 25,939 | 22,433 | |||
| 1961 | 4,194 | 26,403 | 1.8 | 22,208 | -1.0 | |
| 1962 | 3,371 | 27,722 | 5.0 | 24,352 | 9.7 | |
| 1963 | 4,210 | 29,620 | 6.8 | 25,411 | 4.3 | |
| 1964 | 6,022 | 33,340 | 12.6 | 27,319 | 7.5 | |
| 1965 | 4,664 | 35,285 | 5.8 | 30,621 | 12.1 | |
| 1966 | 2,939 | 38,926 | 10.3 | 35,987 | 17.5 | |
| 1967 | 2,604 | 41,333 | 6.2 | 38,729 | 7.6 | |
| 1968 | 250 | 45,544 | 10.2 | 45,292 | 16.9 | |
| 1969 | 90 | 49,220 | 8.1 | 49,130 | 8.5 | |
| 1970 | 2,255 | 56,640 | 15.1 | 54,385 | 10.7 | |
| 1971 | -1,301 | 59,677 | 5.4 | 60,980 | 12.1 | |
| 1972 | -5,443 | 67,223 | 12.6 | 72,664 | 19.2 | |
| 1973 | 1,900 | 91,242 | 35.7 | 89,342 | 23.0 | |
| 1974 | -4,293 | 120,897 | 32.5 | 125,189 | 40.1 | |
| 1975 | 12,403 | 132,585 | 9.7 | 120,181 | -4.0 | |
| 1976 | -6,082 | 142,716 | 7.6 | 148,798 | 23.8 | |
| 1977 | -27,247 | 152,302 | 6.7 | 179,547 | 20.7 | |
| 1978 | -29,763 | 178,428 | 17.2 | 208,191 | 16.0 | |
| 1979 | -24,566 | 224,132 | 25.6 | 248,696 | 19.5 | |
| 1980 | -19,407 | 271,835 | 21.3 | 291,242 | 17.1 | |
| 1981 | -16,172 | 294,399 | 8.3 | 310,570 | 6.6 | |
| 1982 | -24,156 | 275,235 | -6.5 | 299,392 | -3.6 | |
| 1983 | -57,767 | 266,106 | -3.3 | 323,874 | 8.2 | |
| 1984 | -109,074 | 291,094 | 9.4 | 400,166 | 23.6 | |
| 1985 | -121,879 | 289,071 | -0.7 | 410,951 | 2.7 | |
| 1986 | -138,539 | 310,034 | 7.3 | 448,572 | 9.2 | |
| 1987 | -151,683 | 348,869 | 12.5 | 500,553 | 11.6 | |
| 1988 | -114,566 | 431,150 | 23.6 | 545,714 | 9.0 | |
| 1989 | -93,142 | 487,003 | 13.0 | 580,145 | 6.3 | |
| 1990 | -80,865 | 535,234 | 9.9 | 616,098 | 6.2 | |
| 1991 | -31,136 | 578,343 | 8.1 | 609,479 | -1.1 | |
| 1992 | -39,212 | 616,882 | 6.7 | 656,094 | 7.6 | |
| 1993 | -70,311 | 642,863 | 4.2 | 713,174 | 8.7 | |
| 1994 | -98,493 | 703,254 | 9.4 | 801,747 | 12.4 | |
| 1995 | -96,384 | 794,387 | 13.0 | 890,771 | 11.1 | |
| 1996 | -104,065 | 851,602 | 7.2 | 955,667 | 7.3 | |
| 1997 | -108,273 | 934,453 | 9.7 | 1,042,726 | 9.1 | |
| 1998 | -166,140 | 933,174 | -0.1 | 1,099,314 | 5.4 | |
| 1999 | -255,809 | 976,525 | 4.6 | 1,232,335 | 12.1 | |
| 2000 | -369,686 | 1,082,963 | 10.9 | 1,452,650 | 17.9 | |
| 2001 | -360,373 | 1,015,366 | -6.2 | 1,375,739 | -5.3 | |
| 2002 | -420,666 | 986,095 | -2.9 | 1,406,762 | 2.3 | |
| 2003 | -496,243 | 1,028,186 | 4.3 | 1,524,429 | 8.4 | |
| 2004 | -610,838 | 1,168,120 | 13.6 | 1,778,958 | 16.7 | |
| 2005 | -716,542 | 1,291,503 | 10.6 | 2,008,045 | 12.9 | |
| 2006 | -763,533 | 1,463,991 | 13.4 | 2,227,523 | 10.9 | |
| 2007 | -710,997 | 1,660,815 | 13.4 | 2,371,811 | 6.5 | |
| 2008 | -712,350 | 1,849,586 | 11.4 | 2,561,936 | 8.0 | |
| 2009 | -394,771 | 1,592,792 | -13.9 | 1,987,563 | -22.4 | |
| 2010 | -503,087 | 1,872,320 | 17.5 | 2,375,407 | 19.5 | |
| 2011 | -554,522 | 2,143,552 | 14.5 | 2,698,074 | 13.6 | |
| 2012 | -525,906 | 2,247,453 | 4.8 | 2,773,359 | 2.8 | |
| 2013 | -446,861 | 2,313,121 | 2.9 | 2,759,982 | -0.5 | |
| 2014 | -483,952 | 2,392,615 | 3.4 | 2,876,566 | 4.2 | |
| 2015 | -491,421 | 2,280,041 | -4.7 | 2,771,462 | -3.7 | |
| 2016 | -481,475 | 2,238,337 | -1.8 | 2,719,812 | -1.9 | |
| 2017 | -512,739 | 2,390,778 | 6.8 | 2,903,517 | 6.8 | |
| 2018 | -580,950 | 2,538,638 | 6.2 | 3,119,588 | 7.4 | |
| 2019 | -576,341 | 2,528,367 | -0.4 | 3,104,708 | -0.5 | |
| 2020 | -676,684 | 2,134,441 | -15.6 | 2,811,125 | -9.5 | |
| 2021 | -861,383 | 2,532,955 | 18.7 | 3,394,339 | 20.7 |
Source: US Census Bureau
https://www.census.gov/economic-indicators/
IMPORTANT NOTE: Charts IIA-2 through IIA2-4A cannot be updated because of the discontinuance of support of the Adobe Flash Player (https://www.adobe.com/products/flashplayer/end-of-life.html). Updated Versions of fusion charts are shown below each chart.
Chart IIA-2 of the US Census Bureau provides the US trade account in goods and services SA from Jan 1992 to Nov 2020. There is long-term trend of deterioration of the US trade deficit shown vividly by Chart IIA-2. The global recession from IVQ2007 to IIQ2009 reversed the trend of deterioration. Deterioration resumed together with incomplete recovery and was influenced significantly by the carry trade from zero interest rates to commodity futures exposures (these arguments are elaborated in Pelaez and Pelaez, Financial Regulation after the Global Recession (2009a), 157-66, Regulation of Banks and Finance (2009b), 217-27, International Financial Architecture (2005), 15-18, The Global Recession Risk (2007), 221-5, Globalization and the State Vol. II (2008b), 197-213, Government Intervention in Globalization (2008c), 182-4 http://cmpassocregulationblog.blogspot.com/2011/07/causes-of-2007-creditdollar-crisis.html http://cmpassocregulationblog.blogspot.com/2011/01/professor-mckinnons-bubble-economy.html http://cmpassocregulationblog.blogspot.com/2011/01/world-inflation-quantitative-easing.html http://cmpassocregulationblog.blogspot.com/2011/01/treasury-yields-valuation-of-risk.html http://cmpassocregulationblog.blogspot.com/2010/11/quantitative-easing-theory-evidence-and.html http://cmpassocregulationblog.blogspot.com/2010/12/is-fed-printing-money-what-are.html). Earlier research focused on the long-term external imbalance of the US in the form of trade and current account deficits (Pelaez and Pelaez, The Global Recession Risk (2007), Globalization and the State Vol. II (2008b) 183-94, Government Intervention in Globalization (2008c), 167-71). US external imbalances have not been fully resolved and tend to widen together with improving world economic activity and commodity price shocks. There are additional effects for devaluation of the dollar with the Fed orienting interest increases now followed by Janreases and inaction at near zero interest rates while the European Central Bank and the Bank of Japan determine negative nominal interest rates.
Chart IIA-2, US, Balance of Trade SA, Monthly, Millions of Dollars, Jan 1992-Nov 2020
Source: US Census Bureau
https://www.census.gov/economic-indicators/
Chart IIA-2F, US, Balance of Trade SA, Monthly, Millions of Dollars, Jan 1992-Feb 2022
Source: US Census Bureau
https://www.census.gov/economic-indicators/
Char IIA-2A provides the US trade balance showing sharp deterioration in the global recession, with output in the US reaching a high in Feb 2020 (https://www.nber.org/research/data/us-business-cycle-expansions-and-contractions), in the lockdown of economic activity in the COVID-19 event and the through in Apr 2020 (https://www.nber.org/news/business-cycle-dating-committee-announcement-july-19-2021).
Chart IIA-2A, US, Balance of Trade SA, Monthly, Millions of Dollars, Jan 2019-Nov 2020
Source: US Census Bureau
https://www.census.gov/economic-indicators/
Chart IIA-2AF, US, Balance of Trade SA, Monthly, Millions of Dollars, Jan 2019-Feb 2022
Source: US Census Bureau
https://www.census.gov/economic-indicators/
There was sharp acceleration from 2003 to 2007 during worldwide economic boom and increasing inflation. Exports fell sharply during the financial crisis and global recession from IVQ2007 to IIQ2009. Growth picked up again together with world trade and inflation but stalled in the final segment with less rapid global growth and inflation. Exports contracted sharply in Mar-May 2020 in the global recession, with output in the US reaching a high in Feb 2020 (https://www.nber.org/research/data/us-business-cycle-expansions-and-contractions), in the lockdown of economic activity in the COVID-19 event and the through in Apr 2020 (https://www.nber.org/news/business-cycle-dating-committee-announcement-july-19-2021) with partial recovery in Jun-Nov 2020.
Chart IIA-3, US, Exports SA, Monthly, Millions of Dollars Jan 1992-Nov 2020
Source: US Census Bureau
https://www.census.gov/economic-indicators/
Chart IIA-3F, US, Exports SA, Monthly, Millions of Dollars Jan 1992-Feb 2022
Source: US Census Bureau
https://www.census.gov/economic-indicators/
Chart IIA-3A shows sharp contraction of exports in Feb-Apr 2020 followed by recovery.
Chart IIA-3A, US, Exports SA, Monthly, Millions of Dollars Jan 2019-Nov 2020
Source: US Census Bureau
https://www.census.gov/economic-indicators/
Chart IIA-3AF, US, Exports SA, Monthly, Millions of Dollars Jan 2019-Feb 2022
Source: US Census Bureau
https://www.census.gov/economic-indicators/
Growth was stronger between 2003 and 2007 with worldwide economic boom and inflation. There was sharp drop during the financial crisis and global recession. There is stalling import levels in the final segment in Chart IIA-4 resulting from weaker world economic growth and diminishing inflation because of risk aversion and portfolio reallocations from commodity exposures to equities. Imports contracted sharply in the global recession, with output in the US reaching a high in Feb 2020 (https://www.nber.org/research/data/us-business-cycle-expansions-and-contractions), in the lockdown of economic activity in the COVID-19 event and the through in Apr 2020 (https://www.nber.org/news/business-cycle-dating-committee-announcement-july-19-2021) with partial recovery in Jun-Nov 2020.
Chart IIA-4, US, Imports SA, Monthly, Millions of Dollars Jan 1992-Nov 2020
Source: US Census Bureau
https://www.census.gov/economic-indicators/
Chart IIA-4F, US, Imports SA, Monthly, Millions of Dollars Jan 1992-Feb 2022
Source: US Census Bureau
https://www.census.gov/economic-indicators/
Chart IIA-4A shows the sharp contraction of imports in Jan-May 2020 with recovery in Jun-Nov 2020.
Chart IIA-4A, US, Imports SA, Monthly, Millions of Dollars Jan 2019-Nov 2020
Source: US Census Bureau
https://www.census.gov/economic-indicators/
Chart IIA-4AF, US, Imports SA, Monthly, Millions of Dollars Jan 2019-Feb 2022
Source: US Census Bureau
https://www.census.gov/economic-indicators/
There is deterioration of the US trade balance in goods in Table IIA-3 from deficit of $88,675 million in Feb 2021 to deficit of $107,470 million in Feb 2022. The nonpetroleum deficit increased from $86,049 million in Feb 2021 to $103,564 million in Feb 2022 while the petroleum deficit increased from $1545 million in Feb 2021 to deficit of $2781 million in Feb 2022. Total exports of goods increased 21.6 percent in Feb 2022 relative to a year earlier while total imports increased 21.5 percent. Nonpetroleum exports increased 16.1 percent from Feb 2021 to Feb 2022 while nonpetroleum imports increased 17.9 percent. Petroleum imports increased 75.6 percent with recovery of oil prices. Oil use contracted in the global recession, with output in the US reaching a high in Feb 2020 (https://www.nber.org/research/data/us-business-cycle-expansions-and-contractions), in the lockdown of economic activity in the COVID-19 event and the through in Apr 2020 (https://www.nber.org/news/business-cycle-dating-committee-announcement-july-19-2021).
Table IIA-3, US, International Trade in Goods Balance, Exports and Imports $ Millions and ∆% SA
| Feb 2022 | Feb 2021 | ∆% | |
| Total Balance | -107,470 | -88,675 | |
| Petroleum | -2,781 | -1,545 | |
| Non-Petroleum | -103,564 | -86,049 | |
| Total Exports | 158,777 | 130,533 | 21.6 |
| Petroleum | 20,329 | 11,613 | 75.1 |
| Non-Petroleum | 137,620 | 118,550 | 16.1 |
| Total Imports | 266,246 | 219,208 | 21.5 |
| Petroleum | 23,110 | 13,158 | 75.6 |
| Non-Petroleum | 241,184 | 204,600 | 17.9 |
Details may not add because of rounding and seasonal adjustment
Source: US Census Bureau
https://www.census.gov/economic-indicators/
US exports and imports of goods not seasonally adjusted in Jan-Feb 2022 and Jan-Feb 2021 are in Table IIA-4. The rate of growth of exports was 18.4 percent and 21.0 percent for imports. The US has partial hedge of commodity price increases in exports of agricultural commodities that increased 7.3 percent and of mineral fuels that increased 51.5 percent both because prices of raw materials and commodities increase and fall recurrently because of shocks of risk aversion and portfolio reallocations. There is now the impact in the global recession, with output in the US reaching a high in Feb 2020 (https://www.nber.org/research/data/us-business-cycle-expansions-and-contractions), in the lockdown of economic activity in the COVID-19 event and the through in Apr 2020 (https://www.nber.org/news/business-cycle-dating-committee-announcement-july-19-2021). The US exports a growing amount of crude oil, increasing 64.1 percent in cumulative Jan-Feb 2022 relative to a year earlier. US exports and imports consist mostly of manufactured products, with less rapidly increasing prices. US manufactured exports increased 15.9 percent while manufactured imports increased 21.0 percent. Significant part of the US trade imbalance originates in imports of mineral fuels increasing 74.5 percent and petroleum increasing 73.9 percent with wide oscillations in oil prices. The limited hedge in exports of agricultural commodities and mineral fuels compared with substantial imports of mineral fuels and crude oil results in waves of deterioration of the terms of trade of the US, or export prices relative to import prices, originating in commodity price increases caused by carry trades from zero interest rates. These waves are similar to those in worldwide inflation.
Table IIA-4, US, Exports and Imports of Goods, Not Seasonally Adjusted Millions of Dollars and %, Census Basis
| Jan-Feb 2022 $ Millions | Jan-Feb 2021 $ Millions | ∆% | |
| Exports | 298,113 | 251,870 | 18.4 |
| Manufactured | 186,874 | 161,168 | 15.9 |
| Agricultural | 31,490 | 29,341 | 7.3 |
| Mineral Fuels | 47,277 | 31,208 | 51.5 |
| Petroleum | 31,543 | 19,218 | 64.1 |
| Imports | 482,422 | 398,630 | 21.0 |
| Manufactured | 414,390 | 350,249 | 18.3 |
| Agricultural | 30,251 | 24,738 | 22.3 |
| Mineral Fuels | 43,023 | 24,662 | 74.5 |
| Petroleum | 37,622 | 21,637 | 73.9 |
Source: US Census Bureau
https://www.census.gov/economic-indicators/
II United States Current Account of Balance of Payments and International Investment Position. The current account of the US balance of payments is in Table VI-3A for IVQ2020 and IVQ2021. The Bureau of Economic Analysis analyzes as follows (https://www.bea.gov/sites/default/files/2022-03/trans421.pdf):
“The U.S. current-account deficit, which reflects the combined balances on trade in goods and services and income flows between U.S. residents and residents of other countries, narrowed by $2.0 billion, or 0.9 percent, to $217.9 billion in the fourth quarter of 2021, according to statistics released by the U.S. Bureau of Economic Analysis (BEA). The revised third-quarter deficit was $219.9 billion. The fourth-quarter deficit was 3.6 percent of current-dollar gross domestic product (GDP), down from 3.8 percent in the third quarter. The $2.0 billion narrowing of the current-account deficit in the fourth quarter reflected a reduced deficit on secondary income and expanded surpluses on services and on primary income that were mostly offset by an expanded deficit on goods.”
The US has a large deficit in goods or exports less imports of goods but it has a surplus in services that helps to reduce the trade account deficit or exports less imports of goods and services. The current account deficit of the US not seasonally adjusted increased from $175.7 billion in IVQ2020 to $218.4 billion in IVQ2021. The current account deficit seasonally adjusted at annual rate increased from 3.3 percent of GDP in IVQ2020 to 3.8 percent of GDP in IIIQ2021, decreasing at 3.6 percent of GDP in IVQ2021 (using the second update of GDP for IVQ2021 (https://www.bea.gov/sites/default/files/2022-02/gdp4q21_2nd.pdf https://apps.bea.gov/iTable/index_nipa.cfm) in the global recession, with output in the US reaching a high in Feb 2020 (https://www.nber.org/research/data/us-business-cycle-expansions-and-contractions), in the lockdown of economic activity in the COVID-19 event and the through in Apr 2020 (https://www.nber.org/news/business-cycle-dating-committee-announcement-july-19-2021). The ratio of the current account deficit to GDP has stabilized around 3 percent of GDP compared with much higher percentages before the recession but is combined now with much higher imbalance in the Treasury budget (see Pelaez and Pelaez, The Global Recession Risk (2007), Globalization and the State, Vol. II (2008b), 183-94, Government Intervention in Globalization (2008c), 167-71). There is still a major challenge in the combined deficits in current account and in federal budgets.
Table VI-3A, US, Balance of Payments, Millions of Dollars NSA
| IVQ2020 | IVQ2021 | Difference | |
| Goods Balance | -259,332 | -291,623 | -32,291 |
| X Goods | 392,062 | 482,542 | 23.1 ∆% |
| M Goods | -651,394 | -774,165 | 18.8 ∆% |
| Services Balance | 62,849 | 62,885 | 36 |
| X Services | 184,529 | 214,556 | 16.3 ∆% |
| M Services | -121,680 | -151,671 | 24.6 ∆% |
| Balance Goods and Services | -196,482 | -228,738 | -32,256 |
| Exports of Goods and Services and Income Receipts | 870,017 | 1,025,510 | 155,493 |
| Imports of Goods and Services and Income Payments | -1,045,705 | -1,243,922 | -198,218 |
| Current Account Balance | -175,688 | -218,412 | -42,724 |
| % GDP SA | IVQ2020 | IVQ2021 | IIIQ2021 |
| 3.3 | 3.6 | 3.8 |
X: exports; M: imports
Balance on Current Account = Exports of Goods and Services – Imports of Goods and Services and Income Payments
Source: Bureau of Economic Analysis
https://www.bea.gov/data/economic-accounts/international#bop
The following chart of the BEA (Bureau of Economic Analysis) provides the US current account and component balances through IVQ2021. There is improvement in IVQ2021 in the global recession, with output in the US reaching a high in Feb 2020 (https://www.nber.org/research/data/us-business-cycle-expansions-and-contractions), in the lockdown of economic activity in the COVID-19 event and the through in Apr 2020 (https://www.nber.org/news/business-cycle-dating-committee-announcement-july-19-2021) .
Chart VI-3B1*, US, Current Account and Components Balances, Quarterly SA
Source: https://www.bea.gov/sites/default/files/2022-03/trans421.pdf
Chart VI-3B1*, US, Current Account and Components Balances, Quarterly SA
Source: https://www.bea.gov/sites/default/files/2022-03/trans421.pdf
The following chart of the BEA (Bureau of Economic Analysis) provides the US current account and component balances through IIIQ2021. There is deterioration in IIIQ2021 in the global recession, with output in the US reaching a high in Feb 2020 (https://www.nber.org/research/data/us-business-cycle-expansions-and-contractions), in the lockdown of economic activity in the COVID-19 event and the through in Apr 2020 (https://www.nber.org/news/business-cycle-dating-committee-announcement-july-19-2021) .
Chart VI-3B1*, US, Current Account and Components Balances, Quarterly SA
Source: https://www.bea.gov/sites/default/files/2021-12/trans321.pdf
Chart VI-3B1*, US, Current Account and Components Balances, Quarterly SA
Source: https://www.bea.gov/sites/default/files/2021-12/trans321.pdf
The following chart of the BEA (Bureau of Economic Analysis) provides the US current account and component balances through IIQ2021. There is deterioration in IIQ2021 in the global recession, with output in the US reaching a high in Feb 2020 (https://www.nber.org/research/data/us-business-cycle-expansions-and-contractions), in the lockdown of economic activity in the COVID-19 event and the through in Apr 2020 (https://www.nber.org/news/business-cycle-dating-committee-announcement-july-19-2021) .
Chart VI-3B1*, US, Current Account and Components Balances, Quarterly SA
Source: https://www.bea.gov/sites/default/files/2021-09/trans221.pdf
Chart VI-3B1*, US, Current Account and Components Balances, Quarterly SA
Source: https://www.bea.gov/sites/default/files/2021-09/trans221.pdf
The following chart of the BEA (Bureau of Economic Analysis) provides the US current account and component balances through IQ2021. There is deterioration in IQ2021 in the global recession, with output in the US reaching a high in Feb 2020 (https://www.nber.org/cycles.html), in the lockdown of economic ac lockdown of economic activity in the COVID-19 event.
Chart VI-3B1*, US, Current Account and Components Balances, Quarterly SA
Source: https://www.bea.gov/sites/default/files/2021-06/trans121.pdf
Chart VI-3B1*, US, Current Account and Components Balances, Quarterly SA
Source: https://www.bea.gov/sites/default/files/2021-06/trans121.pdf
The following chart of the BEA (Bureau of Economic Analysis) provides the US current account and component balances through IVQ2020. There is deterioration in IVQ2020 in the global recession, with output in the US reaching a high in Feb 2020 (https://www.nber.org/cycles.html), in the lockdown of economic activity in the COVID-19 event.
Chart VI-3B1*, US, Current Account and Components Balances, Quarterly SA
Source: https://www.bea.gov/sites/default/files/2021-03/trans420.pdf
Chart VI-3B1*, US, Current Account and Components Balances, Quarterly SA
Source: https://www.bea.gov/sites/default/files/2021-03/trans420.pdf
The following chart of the BEA (Bureau of Economic Analysis) provides the US current account and component balances through IIIQ2020. There is deterioration in IIIQ2020 the global recession, with output in the US reaching a high in Feb 2020 (https://www.nber.org/cycles.html), in the lockdown of economic activity in the COVID-19 event.
Chart VI-3B1*, US, Current Account and Components Balances, Quarterly SA
Source: https://www.bea.gov/sites/default/files/2020-12/trans320_0.pdf
The BEA analyzes the impact on data of the global recession, with output in the US reaching a high in Feb 2020 (https://www.nber.org/cycles.html), in the lockdown of economic activity in the COVID-19 event:
“Coronavirus (COVID-19) Impact on Second Quarter 2020 International Transactions
All major categories of current account transactions declined in the second quarter of 2020 resulting in part from the impact of COVID-19, as many businesses were operating at limited capacity or ceased operations completely, and the movement of travelers across borders was restricted. In the financial account, the ending of some currency swaps between the U.S. Federal Reserve System and some central banks in Europe and Japan contributed to U.S. withdrawal of deposit assets and U.S. repayment of deposit liabilities. The full economic effects of the COVID-19 pandemic cannot be quantified in the statistics because the impacts are generally embedded in source data and cannot be separately identified. For more information on the impact of COVID-19 on the statistics, see the technical note that accompanies this release.”
Chart VI-3B1*, US, Current Account and Components Balances, Quarterly SA
Source: https://www.bea.gov/news/2020/us-international-transactions-second-quarter-2020
Chart VI-3B1*, US, Current Account and Components Balances, Quarterly SA
Source: https://www.bea.gov/news/2020/us-international-transactions-second-quarter-2020
Chart VI-3B1*, US, Current Account and Components Balances, Quarterly SA
Source: https://www.bea.gov/news/2020/us-international-transactions-first-quarter-2020-and-annual-update
Chart VI-3B1*, US, Current Account Transactions, Quarterly SA
Source: https://www.bea.gov/news/2020/us-international-transactions-first-quarter-2020-and-annual-update
Chart VI-3B1, US, Current Account and Components Balances, Quarterly SA
Source: https://www.bea.gov/news/2019/us-international-transactions-first-quarter-2019-and-annual-update
Chart VI-3B1, US, Current Account and Components Balances, Quarterly SA
Source: https://www.bea.gov/news/2020/us-international-transactions-fourth-quarter-and-year-2019
Chart VI-3B2, US, Current Account and Components Balances, Quarterly SA
Source: https://www.bea.gov/news/2020/us-international-transactions-fourth-quarter-and-year-2019
The Bureau of Economic Analysis (BEA) provides analytical insight and data on the 2017 Tax Cuts and Job Act:
“In the international transactions accounts, income on equity, or earnings, of foreign affiliates of U.S. multinational enterprises consists of a portion that is repatriated to the parent company in the United States in the form of dividends and a portion that is reinvested in foreign affiliates. In response to the 2017 Tax Cuts and Jobs Act, which generally eliminated taxes on repatriated earnings, some U.S. multinational enterprises repatriated accumulated prior earnings of their foreign affiliates. In the first, second, and fourth quarters of 2018, the repatriation of dividends exceeded current-period earnings, resulting in negative values being recorded for reinvested earnings. In the first quarter of 2019, dividends were $100.2 billion while reinvested earnings were $40.2 billion (see table below). The reinvested earnings are also reflected in the net acquisition of direct investment assets in the financial account (table 6). For more information, see "How does the 2017 Tax Cuts and Jobs Act affect BEA’s business income statistics?" and "How are the international transactions accounts affected by an increase in direct investment dividend receipts?"”
Chart VI-3B, US, Direct Investment Earnings Receipts and Components
Source: https://www.bea.gov/news/2019/us-international-transactions-first-quarter-2019-and-annual-update
In their classic work on “unpleasant monetarist arithmetic,” Sargent and Wallace (1981, 2) consider a regime of domination of monetary policy by fiscal policy (emphasis added):
“Imagine that fiscal policy dominates monetary policy. The fiscal authority independently sets its budgets, announcing all current and future deficits and surpluses and thus determining the amount of revenue that must be raised through bond sales and seignorage. Under this second coordination scheme, the monetary authority faces the constraints imposed by the demand for government bonds, for it must try to finance with seignorage any discrepancy between the revenue demanded by the fiscal authority and the amount of bonds that can be sold to the public. Suppose that the demand for government bonds implies an interest rate on bonds greater than the economy’s rate of growth. Then if the fiscal authority runs deficits, the monetary authority is unable to control either the growth rate of the monetary base or inflation forever. If the principal and interest due on these additional bonds are raised by selling still more bonds, so as to continue to hold down the growth of base money, then, because the interest rate on bonds is greater than the economy’s growth rate, the real stock of bonds will growth faster than the size of the economy. This cannot go on forever, since the demand for bonds places an upper limit on the stock of bonds relative to the size of the economy. Once that limit is reached, the principal and interest due on the bonds already sold to fight inflation must be financed, at least in part, by seignorage, requiring the creation of additional base money.”
The alternative fiscal scenario of the CBO (2012NovCDR, 2013Sep17) resembles an economic world in which eventually the placement of debt reaches a limit of what is proportionately desired of US debt in investment portfolios. This unpleasant environment is occurring in various European countries.
The current real value of government debt plus monetary liabilities depends on the expected discounted values of future primary surpluses or difference between tax revenue and government expenditure excluding interest payments (Cochrane 2011Jan, 27, equation (16)). There is a point when adverse expectations about the capacity of the government to generate primary surpluses to honor its obligations can result in increases in interest rates on government debt.
First, Unpleasant Monetarist Arithmetic. Fiscal policy is described by Sargent and Wallace (1981, 3, equation 1) as a time sequence of D(t), t = 1, 2,…t, …, where D is real government expenditures, excluding interest on government debt, less real tax receipts. D(t) is the real deficit excluding real interest payments measured in real time t goods. Monetary policy is described by a time sequence of H(t), t=1,2,…t, …, with H(t) being the stock of base money at time t. In order to simplify analysis, all government debt is considered as being only for one time period, in the form of a one-period bond B(t), issued at time t-1 and maturing at time t. Denote by R(t-1) the real rate of interest on the one-period bond B(t) between t-1 and t. The measurement of B(t-1) is in terms of t-1 goods and [1+R(t-1)] “is measured in time t goods per unit of time t-1 goods” (Sargent and Wallace 1981, 3). Thus, B(t-1)[1+R(t-1)] brings B(t-1) to maturing time t. B(t) represents borrowing by the government from the private sector from t to t+1 in terms of time t goods. The price level at t is denoted by p(t). The budget constraint of Sargent and Wallace (1981, 3, equation 1) is:
D(t) = {[H(t) – H(t-1)]/p(t)} + {B(t) – B(t-1)[1 + R(t-1)]} (1)
Equation (1) states that the government finances its real deficits into two portions. The first portion, {[H(t) – H(t-1)]/p(t)}, is seigniorage, or “printing money.” The second part,
{B(t) – B(t-1)[1 + R(t-1)]}, is borrowing from the public by issue of interest-bearing securities. Denote population at time t by N(t) and growing by assumption at the constant rate of n, such that:
N(t+1) = (1+n)N(t), n>-1 (2)
The per capita form of the budget constraint is obtained by dividing (1) by N(t) and rearranging:
B(t)/N(t) = {[1+R(t-1)]/(1+n)}x[B(t-1)/N(t-1)]+[D(t)/N(t)] – {[H(t)-H(t-1)]/[N(t)p(t)]} (3)
On the basis of the assumptions of equal constant rate of growth of population and real income, n, constant real rate of return on government securities exceeding growth of economic activity and quantity theory equation of demand for base money, Sargent and Wallace (1981) find that “tighter current monetary policy implies higher future inflation” under fiscal policy dominance of monetary policy. That is, the monetary authority does not permanently influence inflation, lowering inflation now with tighter policy but experiencing higher inflation in the future.
Second, Unpleasant Fiscal Arithmetic. The tool of analysis of Cochrane (2011Jan, 27, equation (16)) is the government debt valuation equation:
(Mt + Bt)/Pt = Et∫(1/Rt, t+τ)st+τdτ (4)
Equation (4) expresses the monetary, Mt, and debt, Bt, liabilities of the government, divided by the price level, Pt, in terms of the expected value discounted by the ex-post rate on government debt, Rt, t+τ, of the future primary surpluses st+τ, which are equal to Tt+τ – Gt+τ or difference between taxes, T, and government expenditures, G. Cochrane (2010A) provides the link to a web appendix demonstrating that it is possible to discount by the ex post Rt, t+τ. The second equation of Cochrane (2011Jan, 5) is:
MtV(it, ·) = PtYt (5)
Conventional analysis of monetary policy contends that fiscal authorities simply adjust primary surpluses, s, to sanction the price level determined by the monetary authority through equation (5), which deprives the debt valuation equation (4) of any role in price level determination. The simple explanation is (Cochrane 2011Jan, 5):
“We are here to think about what happens when [4] exerts more force on the price level. This change may happen by force, when debt, deficits and distorting taxes become large so the Treasury is unable or refuses to follow. Then [4] determines the price level; monetary policy must follow the fiscal lead and ‘passively’ adjust M to satisfy [5]. This change may also happen by choice; monetary policies may be deliberately passive, in which case there is nothing for the Treasury to follow and [4] determines the price level.”
An intuitive interpretation by Cochrane (2011Jan 4) is that when the current real value of government debt exceeds expected future surpluses, economic agents unload government debt to purchase private assets and goods, resulting in inflation. If the risk premium on government debt declines, government debt becomes more valuable, causing a deflationary effect. If the risk premium on government debt increases, government debt becomes less valuable, causing an inflationary effect.
There are multiple conclusions by Cochrane (2011Jan) on the debt/dollar crisis and Global recession, among which the following three:
(1) The flight to quality that magnified the recession was not from goods into money but from private-sector securities into government debt because of the risk premium on private-sector securities; monetary policy consisted of providing liquidity in private-sector markets suffering stress
(2) Increases in liquidity by open-market operations with short-term securities have no impact; quantitative easing can affect the timing but not the rate of inflation; and purchase of private debt can reverse part of the flight to quality
(3) The debt valuation equation has a similar role as the expectation shifting the Phillips curve such that a fiscal inflation can generate stagflation effects similar to those occurring from a loss of anchoring expectations.
This analysis suggests that there may be a point of saturation of demand for United States financial liabilities without an increase in interest rates on Treasury securities. A risk premium may develop on US debt. Such premium is not apparent currently because of distressed conditions in the world economy and international financial system. Risk premiums are observed in the spread of bonds of highly indebted countries in Europe relative to bonds of the government of Germany.
The issue of global imbalances centered on the possibility of a disorderly correction (Pelaez and Pelaez, The Global Recession Risk (2007), Globalization and the State Vol. II (2008b) 183-94, Government Intervention in Globalization (2008c), 167-71). Such a correction has not occurred historically but there is no argument proving that it could not occur. The need for a correction would originate in unsustainable large and growing United States current account deficits (CAD) and net international investment position (NIIP) or excess of financial liabilities of the US held by foreigners net relative to financial liabilities of foreigners held by US residents. The IMF estimated that the US could maintain a CAD of two to three percent of GDP without major problems (Rajan 2004). The threat of disorderly correction is summarized by Pelaez and Pelaez, The Global Recession Risk (2007), 15):
“It is possible that foreigners may be unwilling to increase their positions in US financial assets at prevailing interest rates. An exit out of the dollar could cause major devaluation of the dollar. The depreciation of the dollar would cause inflation in the US, leading to increases in American interest rates. There would be an increase in mortgage rates followed by deterioration of real estate values. The IMF has simulated that such an adjustment would cause a decline in the rate of growth of US GDP to 0.5 percent over several years. The decline of demand in the US by four percentage points over several years would result in a world recession because the weakness in Europe and Japan could not compensate for the collapse of American demand. The probability of occurrence of an abrupt adjustment is unknown. However, the adverse effects are quite high, at least hypothetically, to warrant concern.”
The United States could be moving toward a situation typical of heavily indebted countries, requiring fiscal adjustment and increases in productivity to become more competitive internationally. The CAD and NIIP of the United States are not observed in full deterioration because the economy is well below trend. There are two complications in the current environment relative to the concern with disorderly correction in the first half of the past decade. In the release of Jun 14, 2013, the Bureau of Economic Analysis (http://www.bea.gov/newsreleases/international/transactions/2013/pdf/trans113.pdf) informs of revisions of US data on US international transactions since 1999:
“The statistics of the U.S. international transactions accounts released today have been revised for the first quarter of 1999 to the fourth quarter of 2012 to incorporate newly available and revised source data, updated seasonal adjustments, changes in definitions and classifications, and improved estimating methodologies.”
The BEA introduced new concepts and methods (http://www.bea.gov/international/concepts_methods.htm) in comprehensive restructuring on Jun 18, 2014 (http://www.bea.gov/international/modern.htm):
“BEA introduced a new presentation of the International Transactions Accounts on June 18, 2014 and will introduce a new presentation of the International Investment Position on June 30, 2014. These new presentations reflect a comprehensive restructuring of the international accounts that enhances the quality and usefulness of the accounts for customers and bring the accounts into closer alignment with international guidelines.”
Table IIA2-3 provides data on the US fiscal and balance of payments imbalances incorporating all revisions and methods. In 2007, the federal deficit of the US was $161 billion corresponding to 1.1 percent of GDP while the Congressional Budget Office estimates the federal deficit in 2012 at $1077 billion or 6.7 percent of GDP. The estimate of the deficit for 2013 is $680 billion or 4.1 percent of GDP. The combined record federal deficits of the US from 2009 to 2012 are $5094 billion or 31.6 percent of the estimate of GDP for fiscal year 2012 implicit in the CBO (CBO 2013Sep11) estimate of debt/GDP. The deficits from 2009 to 2012 exceed one trillion dollars per year, adding to $5.084 trillion in four years, using the fiscal year deficit of $1077 billion for fiscal year 2012, which is the worst fiscal performance since World War II. Federal debt in 2007 was $5035 billion, slightly less than the combined deficits from 2009 to 2012 of $5084 billion. Federal debt in 2012 was 70.3 percent of GDP (CBO 2015Jan26) and 72.2 percent of GDP in 2013, as shown in Table VI-3B with the latest revisions (https://www.cbo.gov/about/products/budget-economic-data#2) . This situation may worsen in the future (CBO 2013Sep17):
“Between 2009 and 2012, the federal government recorded the largest budget deficits relative to the size of the economy since 1946, causing federal debt to soar. Federal debt held by the public is now about 73 percent of the economy’s annual output, or gross domestic product (GDP). That percentage is higher than at any point in U.S. history except a brief period around World War II, and it is twice the percentage at the end of 2007. If current laws generally remained in place, federal debt held by the public would decline slightly relative to GDP over the next several years, CBO projects. After that, however, growing deficits would ultimately push debt back above its current high level. CBO projects that federal debt held by the public would reach 100 percent of GDP in 2038, 25 years from now, even without accounting for the harmful effects that growing debt would have on the economy. Moreover, debt would be on an upward path relative to the size of the economy, a trend that could not be sustained indefinitely.
The gap between federal spending and revenues would widen steadily after 2015 under the assumptions of the extended baseline, CBO projects. By 2038, the deficit would be 6½ percent of GDP, larger than in any year between 1947 and 2008, and federal debt held by the public would reach 100 percent of GDP, more than in any year except 1945 and 1946. With such large deficits, federal debt would be growing faster than GDP, a path that would ultimately be unsustainable.
Incorporating the economic effects of the federal policies that underlie the extended baseline worsens the long-term budget outlook. The increase in debt relative to the size of the economy, combined with an increase in marginal tax rates (the rates that would apply to an additional dollar of income), would reduce output and raise interest rates relative to the benchmark economic projections that CBO used in producing the extended baseline. Those economic differences would lead to lower federal revenues and higher interest payments. With those effects included, debt under the extended baseline would rise to 108 percent of GDP in 2038.”
The most recent CBO long-term budget on Jun 25, 2019 projects US federal debt at 144.0 percent of GDP in 2049 (Congressional Budget Office, The 2019 long-term budget outlook. Washington, DC, Jun 25 https://www.cbo.gov/publication/55331). Table VI-3B provides the balance of payments and net international investment position together with the fiscal imbalances of the US that were critical at the onset of the global recession after 2007 (Pelaez and Pelaez, Financial Regulation after the Global Recession (2009a), 157-66, Regulation of Banks and Finance (2009b), 217-27, International Financial Architecture (2005), 15-18, The Global Recession Risk (2007), 221-5, Globalization and the State Vol. II (2008b), 197-213, Government Intervention in Globalization (2008c), 182-4). Several past comments of this blog elaborate on these arguments, among which: http://cmpassocregulationblog.blogspot.com/2011/07/causes-of-2007-creditdollar-crisis.html http://cmpassocregulationblog.blogspot.com/2011/01/professor-mckinnons-bubble-economy.html http://cmpassocregulationblog.blogspot.com/2011/01/world-inflation-quantitative-easing.html http://cmpassocregulationblog.blogspot.com/2011/01/treasury-yields-valuation-of-risk.html http://cmpassocregulationblog.blogspot.com/2010/11/quantitative-easing-theory-evidence-and.html http://cmpassocregulationblog.blogspot.com/2010/12/is-fed-printing-money-what-are.html ) and are exploding again with the fiscal stimulus of the COVID-19 event.
Table VI-3B, US, Current Account, NIIP, Fiscal Balance, Nominal GDP, Federal Debt and Direct Investment, Dollar Billions and %
| 2007 | 2008 | 2009 | 2010 | 2011 | |
| Goods & | -705 | -709 | -384 | -495 | -549 |
| Exports Goods & Services & Income Receipts | 2559.3 | 2742.3 | 2283.1 | 2624.0 | 2981.5 |
| Imports Goods & Services & Income Payments | -3270.4 | -3423.6 | -2655.6 | -3055.3 | -3427.2 |
| Current Account | -711 | -681 | -373 | -431 | -445 |
| NGDP | 14452 | 14713 | 14449 | 14992 | 15543 |
| Current Account % GDP | -4.9 | -4.6 | -2.6 | -2.9 | -2.9 |
| NIIP | -1279 | -3995 | -2628 | -2512 | -4455 |
| US Owned Assets Abroad | 20705 | 19423 | 19426 | 21767 | 22209 |
| Foreign Owned Assets in US | 21984 | 23418 | 22054 | 24279 | 26664 |
| NIIP % GDP | -8.8 | -27.2 | -18.2 | -16.8 | -28.7 |
| Exports | 2559 | 2742 | 2283 | 2624 | 2982 |
| NIIP % | -50 | -146 | -115 | -96 | -149 |
| DIA MV | 5858 | 3707 | 4945 | 5486 | 5215 |
| DIUS MV | 4134 | 3091 | 3619 | 4099 | 4199 |
| Fiscal Balance | -161 | -459 | -1413 | -1294 | -1300 |
| Fiscal Balance % GDP | -1.1 | -3.1 | -9.8 | -8.7 | -8.4 |
| Federal Debt | 5035 | 5803 | 7545 | 9019 | 10128 |
| Federal Debt % GDP | 35.2 | 39.4 | 52.3 | 60.8 | 65.8 |
| Federal Outlays | 2729 | 2983 | 3518 | 3457 | 3603 |
| ∆% | 2.8 | 9.3 | 17.9 | -1.7 | 4.2 |
| % GDP | 19.1 | 20.2 | 24.4 | 23.3 | 23.4 |
| Federal Revenue | 2568 | 2524 | 2105 | 2163 | 2303 |
| ∆% | 6.7 | -1.7 | -16.6 | 2.7 | 6.5 |
| % GDP | 18.0 | 17.1 | 14.6 | 14.6 | 15.0 |
| 2012 | 2013 | 2014 | 2015 | 2016 | |
| Goods & | -537 | -461 | -490 | -499 | -503 |
| Exports Goods & Services & Income Receipts | 3095.0 | 3213.0 | 3341.8 | 3207.3 | 3188.5 |
| Exports Goods & Services & Income Receipts | 3521.9 | 3561.8 | 3707.0 | -3615.1 | 3616.9 |
| Current Account | -426 | -349 | -365 | -408 | -428 |
| NGDP | 16197 | 16785 | 17527 | 18225 | 18715 |
| Current Account % GDP | -2.6 | -2.1 | -2.1 | -2.2 | -2.3 |
| NIIP | -4518 | -5369 | -6945 | -7462 | -8192 |
| US Owned Assets Abroad | 22562 | 24145 | 24883 | 23431 | 24060 |
| Foreign Owned Assets in US | 27080 | 29513 | 31828 | 30892 | 32252 |
| NIIP % GDP | -27.9 | -32.0 | -39.6 | -40.9 | -43.8 |
| Exports | 3095 | 3213 | 3342 | 3207 | 3189 |
| NIIP % | -146 | -167 | -208 | -233 | -257 |
| DIA MV | 5969 | 7121 | 72421 | 7057 | 7422 |
| DIUS MV | 4662 | 5815 | 6370 | 6729 | 7596 |
| Fiscal Balance | -1077 | -680 | -485 | -442 | -585 |
| Fiscal Balance % GDP | -6.7 | -4.1 | -2.8 | -2.4 | -3.2 |
| Federal Debt | 11281 | 11983 | 12780 | 13117 | 14168 |
| Federal Debt % GDP | 70.3 | 72.2 | 73.7 | 72.5 | 76.4 |
| Federal Outlays | 3527 | 3455 | 3506 | 3692 | 3853 |
| ∆% | -2.1 | -2.0 | 1.5 | 5.3 | 4.4 |
| % GDP | 22.0 | 20.8 | 20.2 | 20.4 | 20.8 |
| Federal Revenue | 2450 | 2775 | 3022 | 3250 | 3268 |
| ∆% | 6.4 | 13.3 | 8.9 | 7.6 | 0.6 |
| % GDP | 15.3 | 16.7 | 17.4 | 18.0 | 17.6 |
| 2017 | 2018 | 2019 | |||
| Goods & | -550 | -628 | -616 | ||
| Exports Goods & Services & Income Receipts | 3444.8 | 3735.7 | 3763.9 | ||
| Imports Goods & Services & Income Payments | 3884.5 | 4226.7 | 4262.3 | ||
| Current Account | -440 | -491 | -498 | ||
| NGDP | 19519 | 20580 | 21428 | ||
| Current Account % GDP | 2.3 | 2.4 | 2.3 | ||
| NIIP | -7743 | -9555 | -10991 | ||
| US Owned Assets Abroad | 27773 | 25241 | 29317 | ||
| Foreign Owned Assets in US | 35516 | 34796 | 40309 | ||
| NIIP % GDP | -39.7 | -46.4 | -51.3 | ||
| Exports | 3445 | 3736 | 3764 | ||
| NIIP % | -225 | -256 | -292 | ||
| DIA MV | 8910 | 7504 | 8838 | ||
| DIUS MV | 8925 | 8483 | 10581 | ||
| Fiscal Balance | -665 | -779 | -984 | ||
| Fiscal Balance % GDP | -3.5 | -3.8 | -4.6 | ||
| Federal Debt | 14665 | 15750 | 16803 | ||
| Federal Debt % GDP | 76.0 | 77.4 | 79.2 | ||
| Federal Outlays | 3982 | 4109 | 4447 | ||
| ∆% | 3.3 | 3.2 | 8.2 | ||
| % GDP | 20.6 | 20.2 | 21.0 | ||
| Federal Revenue | 3316 | 3330 | 3462 | ||
| ∆% | 1.5 | 0.4 | 4.0 | ||
| % GDP | 17.2 | 16.4 | 16.3 |
Sources:
Notes: NGDP: nominal GDP or in current dollars; NIIP: Net International Investment Position; DIA MV: US Direct Investment Abroad at Market Value; DIUS MV: Direct Investment in the US at Market Value. There are minor discrepancies in the decimal point of percentages of GDP between the balance of payments data and federal debt, outlays, revenue and deficits in which the original number of the CBO source is maintained. See Bureau of Economic Analysis, US International Economic Accounts: Concepts and Methods. 2014. Washington, DC: BEA, Department of Commerce, Jun 2014 http://www.bea.gov/international/concepts_methods.htm These discrepancies do not alter conclusions. Budget http://www.cbo.gov/
https://www.cbo.gov/about/products/budget-economic-data#6
https://www.cbo.gov/about/products/budget_economic_data#3
https://www.cbo.gov/about/products/budget-economic-data#2
https://www.cbo.gov/about/products/budget_economic_data#2 Balance of Payments and NIIP http://www.bea.gov/international/index.htm#bop Gross Domestic Product, , Bureau of Economic Analysis (BEA) http://www.bea.gov/iTable/index_nipa.cfm
Table VI-3C provides quarterly estimates NSA of the external imbalance of the United States. The current account deficit as percent of GDP at 2.2 percent in IIIQ2019 decreases to 2.2 percent in IVQ2019. The current account deficit at 2.1 percent in IQ2020 increases to 3.2 percent in IIQ2020. The current account deficit increases to 3.3 percent in IIIQ2020. The current account deficit stabilizes to 3.3 percent of GDP in IVQ2020. The current account deficit increases to 3.4 percent in IQ2021. The current account deficit increases to 3.5 percent of GDP in IIQ2021. The current account deficit increases to 3.8 percent in IIIQ2021. The current account deficit decreases to 3.6 percent of GDP in IVQ2021. The absolute value of the net international investment position increases to $13.8 trillion in IIIQ2020. The absolute value of the net international position increases to $14.0 trillion in IVQ2020. The absolute value of the net international investment position increased to $14.3 trillion in IQ2021. The absolute value of the net international investment position increases to $15.9 trillion in IIQ2021. The absolute value of the net international investment position increases to $16.4 trillion in IIIQ2021. The absolute value of the net international investment position increases to $18.1 trillion in IVQ2021. The BEA explains as follows (https://www.bea.gov/sites/default/files/2022-03/intinv421.pdf): “
- The U.S. net international investment position (IIP), the difference between U.S. residents’ foreign financial assets and liabilities, was –$18.10 trillion at the end of the fourth quarter of 2021, according to statistics released today by the U.S. Bureau of Economic Analysis (BEA). Assets totaled $35.21 trillion, and liabilities were $53.31 trillion. At the end of the third quarter, the net investment position was –$16.35 trillion. The net investment positions and components of assets and liabilities are presented in table 1.
- U.S. assets increased by $779.2 billion to a total of $35.21 trillion at the end of the fourth quarter, mostly reflecting increases in direct investment and portfolio investment assets. Direct investment assets increased by $498.7 billion to $11.03 trillion and portfolio investment assets increased by $265.6 billion to $16.42 trillion, driven mainly by increases in foreign stock prices that raised the value of these assets.
- U.S. liabilities increased by $2.53 trillion to a total of $53.31 trillion at the end of the fourth quarter, mostly reflecting increases in direct investment and portfolio investment liabilities. Direct investment liabilities increased by $1.27 trillion to $14.84 trillion and portfolio investment liabilities increased by $1.16 trillion to $28.59 trillion, driven mainly by increases in U.S. stock prices that raised the value of these liabilities.”
Table VI-3C, US, Current Account, Net International Investment Position and Direct Investment, Dollar Billions, NSA
| IIIQ2020 | IVQ2020 | IQ2021 | IIQ2021 | IIIQ2021 | IVQ2021 | |
| Goods & | -204 | -196 | -176 | -208 | -248 | -229 |
| Primary Income | 49 | 54 | 50 | 39 | 43 | 44 |
| Secondary Income | -34 | -33 | -33 | -30 | -38 | -33 |
| Current Account | -189 | -176 | -160 | -199 | -245 | -218 |
| Current Account % GDP SA | 3.3 | 3.3 | 3.4 | 3.5 | 3.8 | 3.6 |
| NIIP | -13767 | -14011 | -14301 | -15906 | -16351 | -18101 |
| US Owned Assets Abroad | 29518 | 32256 | 32838 | 34273 | 34432 | 35211 |
| Foreign Owned Assets in US | -43285 | -46268 | -47139 | -50179 | -50783 | -53312 |
| DIA MV | 8346 | 9405 | 9892 | 10563 | 10536 | 11034 |
| DIUS MV | 10843 | 11978 | 12563 | 13473 | 13574 | 14840 |
Notes: NIIP: Net International Investment Position; DIA MV: US Direct Investment Abroad at Market Value; DIUS MV: Direct Investment in the US at Market Value. See Bureau of Economic Analysis, US International Economic Accounts: Concepts and Methods. 2014. Washington, DC: BEA, Department of Commerce, Sep 2014
https://www.bea.gov/international/concepts_methods.htm
Chart VI-3CA of the US Bureau of Economic Analysis provides the quarterly and annual US net international investment position (NIIP) NSA in billion dollars. The NIIP deteriorated in 2008, improving in 2009-2011 followed by deterioration after 2012. There is improvement in 2017 and deterioration in 2018.
Chart VI-3CA, US Net International Investment Position, NSA, Billion US Dollars
Source: Bureau of Economic Analysis
http://www.bea.gov/newsreleases/international/intinv/intinvnewsrelease.htm
Chart VI-3C, US Net International Investment Position, NSA, Billion US Dollars
Source: Bureau of Economic Analysis
http://www.bea.gov/newsreleases/international/intinv/intinvnewsrelease.htm
Chart VI-3C1 provides the quarterly NSA NIIP.
Chart VI-3C1, US Net International Investment Position, NSA, Billion US Dollars
Source: Bureau of Economic Analysis
http://www.bea.gov/newsreleases/international/intinv/intinvnewsrelease.htm
Chart VI-3C2 updates annual and quarterly estimates of the US Net International Investment Position. There is continuing deterioration.
Chart VI-3C2, US Net International Investment Position, NSA, Billion US Dollars
Source: Bureau of Economic Analysis
http://www.bea.gov/newsreleases/international/intinv/intinvnewsrelease.htm
Chart VI-3C2 updates quarterly estimates of the US Net International Investment Position. There is continuing deterioration.
Chart VI-3C3, US Net International Investment Position, NSA, Billion US Dollars
Source: Bureau of Economic Analysis
http://www.bea.gov/newsreleases/international/intinv/intinvnewsrelease.htm
Chart VI-3C3, US Net International Investment Position, NSA, Billion US Dollars
Source: Bureau of Economic Analysis
https://www.bea.gov/news/2019/us-international-investment-position-third-quarter-2019
Chart VI-3C4, US Net International Investment Position, NSA, Billion US Dollars
Source: Bureau of Economic Analysis
https://www.bea.gov/news/2020/us-international-investment-position-fourth-quarter-and-year-2019
Chart VI-3C4, US Net International Investment Position, NSA, Billion US Dollars
Source: Bureau of Economic Analysis
Chart VI-3C4, US Net International Investment Position, NSA, Billion US Dollars
Source: Bureau of Economic Analysis
https://www.bea.gov/news/2020/us-international-investment-position-second-quarter-2020
Chart VI-3C4, US Net International Investment Position, NSA, Billion US Dollars
Source: Bureau of Economic Analysis
https://www.bea.gov/news/2020/us-international-investment-position-third-quarter-2020
Chart VI-3C4, US Net International Investment Position, NSA, Billion US Dollars
Source: Bureau of Economic Analysis
https://www.bea.gov/news/2020/us-international-investment-position-third-quarter-2020
Chart VI-3C4, US Net International Investment Position, NSA, Billion US Dollars
Source: Bureau of Economic Analysis
https://www.bea.gov/news/2021/us-international-investment-position-fourth-quarter-and-year-2020
Chart VI-3C4, US Net International Investment Position, NSA, Billion US Dollars
Source: Bureau of Economic Analysis
https://www.bea.gov/news/2021/us-international-investment-position-fourth-quarter-and-year-2020
Chart VI-3C4, US Net International Investment Position, NSA, Billion US Dollars
Source: Bureau of Economic Analysis
Chart VI-3C4, US Net International Investment Position, NSA, Billion US Dollars
Source: Bureau of Economic Analysis
Chart VI-3C4, US Net International Investment Position, NSA, Billion US Dollars
Source: Bureau of Economic Analysis
https://www.bea.gov/news/2021/us-international-investment-position-second-quarter-2021
Chart VI-3C4, US Net International Investment Position, NSA, Billion US Dollars
Source: Bureau of Economic Analysis
https://www.bea.gov/news/2021/us-international-investment-position-second-quarter-2021
Chart VI-3C5, US Net International Investment Position, NSA, Billion US Dollars
Source: Bureau of Economic Analysis
https://www.bea.gov/news/2021/us-international-investment-position-third-quarter-2021
Chart VI-3C5A, US Net International Investment Position, NSA, Billion US Dollars
Source: Bureau of Economic Analysis
https://www.bea.gov/news/2021/us-international-investment-position-third-quarter-2021
Chart VI-3C6A, US Net International Investment Position, NSA, Billion US Dollars
Source: Bureau of Economic Analysis
https://www.bea.gov/news/2022/us-international-investment-position-fourth-quarter-and-year-2021
Chart VI-3C6A, US Net International Investment Position, NSA, Billion US Dollars
Source: Bureau of Economic Analysis
https://www.bea.gov/news/2022/us-international-investment-position-fourth-quarter-and-year-2021
Chart VI-3C6A, US Net International Investment Position, NSA, Billion US Dollars
Source: Bureau of Economic Analysis
https://www.bea.gov/news/2022/us-international-investment-position-fourth-quarter-and-year-2021
Chart VI-3C6A, US Net International Investment Position, NSA, Billion US Dollars
Source: Bureau of Economic Analysis
https://www.bea.gov/news/2022/us-international-investment-position-fourth-quarter-and-year-2021
© Carlos M. Pelaez, 2009, 2010, 2011, 2012, 2013, 2014, 2015, 2016, 2017, 2018, 2019, 2020, 2021, 2022.
No comments:
Post a Comment